Abstract
Background: Malnutrition and depression are common and interrelated conditions among community-dwelling older adults, leading to adverse health outcomes. This study aimed to compare the predictive value of Mini Nutritional Assessment–Short Form (MNA-SF), the Seniors in the Community: Risk Evaluation for Eating and Nutrition, version II (SCREEN II), and the Global Leadership Initiative on Malnutrition (GLIM) in assessing depression risk among community-dwelling older adults.
Methods: This cross sectional study was performed in community dwelling older adults. Nutritional status was assessed using the MNA-SF, SCREEN II, and GLIM criteria, and depression risk was evaluated by the Geriatric Depression Scale (GDS).
Results: This study included 251 participants. The median age of participants was 62 years (IQR: 61–70), and 53.4% were female. After adjusting for age, gender, marital status, and employment status, all three nutritional tools were significantly associated with depression risk (MNA-SF: OR = 0.621 [95% CI: 0.523–0.736], p < 0.001; SCREEN II: OR = 0.920 [95% CI: 0.885–0.957], p < 0.001; GLIM: OR = 0.298 [95% CI: 0.141–0.629], p = 0.001). ROC analysis indicated that MNA-SF had the highest predictive accuracy (AUC: 0.765, p < 0.001), followed by SCREEN II (AUC: 0.700, p<0.001) and GLIM (AUC: 0.590, p = 0.014). Delong test showed no significant difference between MNA-SF and SCREEN II (p = 0.18), whereas GLIM had lower accuracy (MNA-SF vs. GLIM: p < 0.001; SCREEN II vs. GLIM: p=0.013).
Conclusion: MNA-SF, SCREEN II, and GLIM were all associated with depression risk, with MNA-SF showing the strongest predictive ability. Comprehensive nutritional screening may support early identification and intervention for depression among community-dwelling older adults.
Keywords: depression, malnutrition, malnutrition screening tools, older adult
Main Points
- Poor nutritional status is associated with a higher risk of depression in older adults.
- MNA-SF, SCREEN II, and GLIM remained significantly associated with depression risk even after adjusting for sociodemographic factors.
- MNA-SF showed the strongest predictive value for depression risk, followed by SCREEN II, while GLIM demonstrated the lowest performance.
Introduction
Malnutrition and depression are prevalent and interrelated health concerns among older adults, and both are associated with adverse outcomes such as reduced functional capacity, increased morbidity, lower quality of life, and higher healthcare utilization.1-3 Depression is linked to decreased appetite, diminished motivation to prepare or consume meals, and weight loss4-6, while malnutrition can exacerbate depressive symptoms through metabolic, inflammatory, and neurocognitive pathways.1,7 Understanding this bidirectional relationship is essential for early identification and intervention in aging populations.
Accurate nutritional assessment is central to identifying older adults at risk for adverse health outcomes. Several validated tools are commonly used in clinical and community settings. The Mini Nutritional Assessment–Short Form (MNA-SF) is brief and has strong predictive validity, focusing on undernutrition and weight loss-related risk.8,9 The Seniors in the Community: Risk Evaluation for Eating and Nutrition, version II (SCREEN II) provides a broader evaluation, including unintentional weight loss and gain, dietary behaviors, psychosocial factors such as mood and motivation, and social participation, making it particularly suitable for community-dwelling older adults.10,11 In contrast, the Global Leadership Initiative on Malnutrition (GLIM) criteria offer a concise, diagnosis-oriented approach that emphasizes objective phenotypic and etiologic indicators, such as weight loss and reduced muscle mass, providing a definitive diagnostic framework rather than a risk screening.12
Despite the widespread use of these tools, few studies have compared their efficacy in identifying older adults at risk of depression. Understanding the differences in assessment focus—MNA-SF targeting undernutrition, SCREEN II evaluating dietary and psychosocial factors, and GLIM emphasizing diagnostic phenotypic indicators—may inform optimal tool selection. This study aimed to compare the predictive performance of MNA-SF, SCREEN II, and GLIM for identifying depression risk in community-dwelling older adults.
Methods
Study design, population
This study employed a cross-sectional design and was conducted among community-dwelling older adults. Participants were recruited using a convenience sampling approach by a clinical dietitian experienced in geriatric care between July and September 2025. Eligible participants were individuals aged 60 years and older living in the community. Exclusion criteria included a diagnosis of advanced malignancy, Alzheimer’s disease, depression, or receipt of enteral or parenteral nutritional support. A minimum sample size of 104 was calculated using G*Power software, based on an alpha of 0.05, power of 0.80, and a medium effect size (Cohen’s d = 0.5). All participants provided written informed consent. This study protocol was approved by ***** University Ethics Committee (Number: 298, Date: 26.06.2025).
Data collection
Data on age, gender, marital status, income, smoking and alcohol use, and chronic diseases were recorded via self-report. Body weight was measured using a calibrated digital scale (accuracy: 0.1 kg) with participants fasting and wearing light clothing. Height was measured using a wall-mounted stadiometer (accuracy: 0.1 cm), with participants standing barefoot in the Frankfurt horizontal plane. Body mass index (BMI) was calculated as weight (kg) divided by height squared (m²).
Nutritional assessment
Nutritional status of the study participants was assessed using the MNA-SF, SCREEN II, and the GLIM criteria. When participants were unable to provide accurate information, caregivers were consulted for clarification.
The MNA-SF evaluates six domains: recent decline in food intake, unintentional weight loss, mobility, the presence of psychological stress or acute illness, neuropsychological problems, and body mass index or calf circumference. MNA-SF scores were interpreted as follows: 0–7 indicated malnutrition, 8–11 indicated risk of malnutrition, and 12–14 indicated normal nutritional status.8
SCREEN II was used to assess dietary habits, recent weight changes, meal preparation and grocery shopping abilities, social eating patterns, physical limitations such as chewing or swallowing difficulties, and changes in daily routines. SCREEN II scores were classified as 0–49 for high malnutrition risk, 50–54 for malnutrition risk, and ≥55 for normal nutritional status.10
The GLIM framework was applied through a standardized two-step diagnostic approach. In the first step, malnutrition risk was screened using the MNA-SF. Participants identified as at risk were then evaluated using the GLIM diagnostic criteria. A diagnosis required the presence of at least one phenotypic and one etiologic criterion. Phenotypic criteria included unintentional weight loss, low body mass index, and reduced muscle mass. Etiologic criteria included reduced food intake or assimilation and the presence of acute or chronic inflammation.12
Depression assessment
Depressive symptoms were assessed using the Geriatric Depression Scale (GDS), a widely used self-report screening tool designed to identify depressive symptoms in older adults. The scale consists of 30 yes/no items that evaluate mood, cognitive, and somatic symptoms related to depression. Total scores range from 0 to 30, with higher scores indicating greater depressive symptomatology. Scores between 0 and 9 are considered normal, 10 to 19 indicate mild depression, and 20 to 30 indicate severe depression 13. In this study, a GDS score of ≥10 was used to indicate the presence of depression.
Statistical analysis
All statistical analyses were performed using R software (R Foundation for Statistical Computing, Vienna, Austria). Continuous variables are presented as medians with interquartile ranges (IQRs), and categorical variables as frequencies and percentages. Group comparisons were conducted using the Mann–Whitney U test for continuous variables and the Chi-square test for categorical variables. Multiple logistic regression models were applied to examine the associations between malnutrition screening tools (MNA-SF, SCREEN II, and GLIM) and depression, adjusting for potential confounders including age, gender, marital status, and employment status. Model fit was assessed using the Hosmer–Lemeshow goodness-of-fit test and Nagelkerke R². Multicollinearity was checked using variance inflation factors (VIF < 5 was considered acceptable). Receiver operating characteristic (ROC) curve analyses were performed to evaluate the discriminative ability of each tool for identifying depression (GDS ≥ 10). The area under the ROC curve (AUC) and optimal cut-off points (Youden index) were reported, along with 95% confidence intervals (CI) for sensitivity and specificity. Pairwise comparisons of AUCs were performed using DeLong’s test to assess differences in predictive accuracy. A two-tailed p-value < 0.05 was considered statistically significant.
Results
A total of 251 participants were included in the study. The median age of the study population was 62 years (IQR: 61–70), and 53.4% were female. Of the total, 107 participants were identified as being at risk of depression. Participants with depression risk were significantly older than those without depression (median age: 65 [IQR: 60–71] vs. 62 [IQR: 60–66], p = 0.003). The proportion of females was higher in the depression group compared with the non-depression group (65.5% vs. 44.4%, p = 0.001).
Regarding marital status, individuals with depression were less likely to be married (72.0% vs. 88.2%) and more likely to be divorced or widowed (27.1% vs. 9.7%), differences which were statistically significant (p = 0.001). Unemployment was more prevalent among participants with depression compared with those without (63.6% vs. 47.2%, p = 0.012) In terms of comorbidities, hypertension was significantly more common in the depression group than in the non-depression group (43.0% vs. 26.4%, p = 0.006) (Table 1).
| BMI: Body mass index. | ||||
| Table 1. Sociodemographic and clinical characteristics of the study participants | ||||
| Variable |
|
|
|
|
| Age, years |
|
|
|
|
| Gender, n (%) | ||||
| Male |
|
|
|
|
| Female |
|
|
|
|
| BMI, kg/m2 |
|
|
|
|
| Marriage status, n (%) | ||||
| Married |
|
|
|
|
| Single |
|
|
|
|
| Divorced/Widowed |
|
|
|
|
| Employment Status, n(%) | ||||
| Employed |
|
|
|
|
| Unemployed |
|
|
|
|
| Retired |
|
|
|
|
| Living arrangement | ||||
| Living alone |
|
|
|
|
| Living with partner |
|
|
|
|
| Living with partner and children |
|
|
|
|
| Income status, n (%) | ||||
| Income > Expenses |
|
|
|
|
| Income = Expenses |
|
|
|
|
| Income < Expenses |
|
|
|
|
| Current smokers, n (%) |
|
|
|
|
| Alcohol users, n (%) |
|
|
|
|
| Comorbidities, n (%) | ||||
| Hypertension |
|
|
|
|
| Diabetes mellitus |
|
|
|
|
| Cardiovascular disease |
|
|
|
|
| Pulmonary disease |
|
|
|
|
| Malignancy |
|
|
|
|
| Chronic kidney disease |
|
|
|
|
| Dyslipidemia |
|
|
|
|
| Hypothyroidism |
|
|
|
|
According to MNA-SF, 34.7% of participants were at risk of malnutrition, and 4.8% were classified as malnourished. Using SCREEN II, 18.3% of participants were at nutritional risk, and 13.1% were at high nutritional risk. Based on GLIM criteria, 16.7% of the study sample were malnourished.
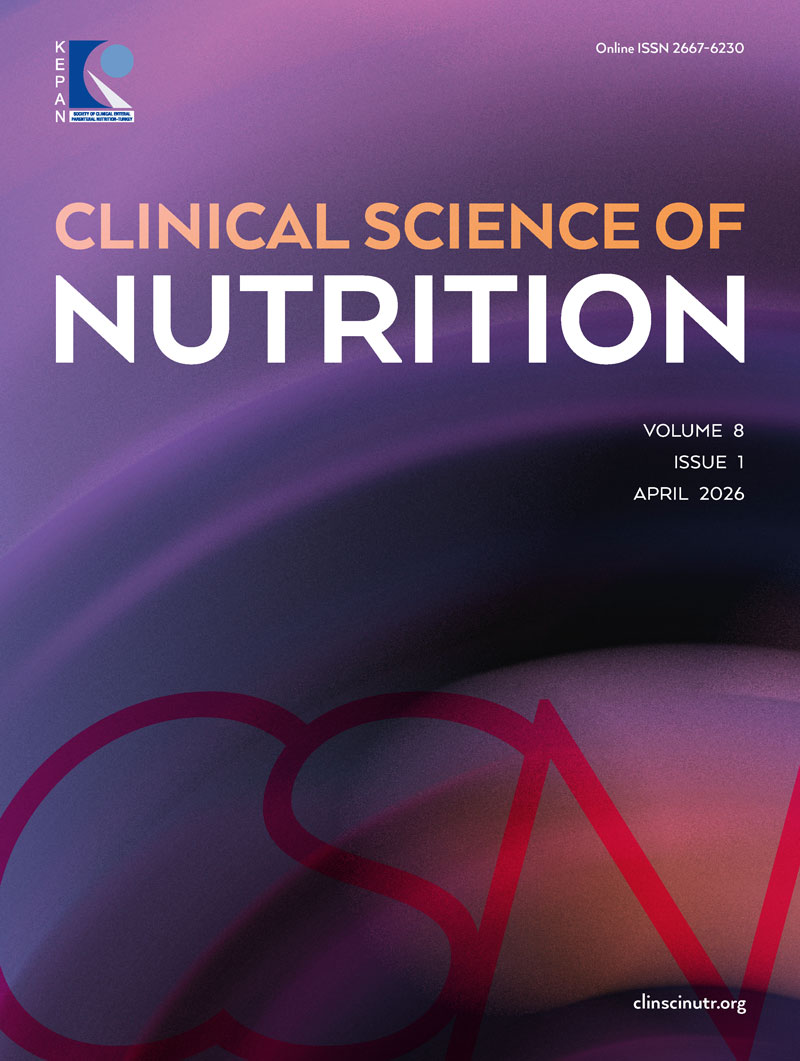
As shown in Figure 1, the prevalence of depression increased progressively with worsening nutritional status across all tools. According to MNA-SF, 23.7% of well-nourished participants had depression, compared with 69.0% of those at risk of malnutrition and 91.7% of malnourished participants. Similarly, using SCREEN II, depression was present in 33.1% of well-nourished participants, 54.3% of those at nutritional risk, and 75.8% of participants classified as high nutritional risk. According to GLIM, 37.3% of well-nourished participants had depression, whereas 73.0% of malnourished participants exhibited depression. Individuals classified as malnourished by all three assessment tools had significantly higher rates of depression (p < 0.001 for all tests).
Logistic regression analysis exhibited that MNA-SF, SCREEN II, and GLIM classifications were all significantly associated with depression risk (MNA-SF: OR = 0.585, 95% CI: 0.497–0.689, p < 0.001; SCREEN II: OR = 0.904, 95% CI: 0.870–0.939, p < 0.001; GLIM: OR = 0.267, 95% CI: 0.131–0.544, p < 0.001). After adjustment for age, gender, marital status, and employment status, poorer nutritional status remained significantly associated with higher odds of depression (MNA-SF: OR = 0.621, 95% CI: 0.523–0.736, p < 0.001; SCREEN II: OR = 0.920, 95% CI: 0.885–0.957, p < 0.001; GLIM: OR = 0.298, 95% CI: 0.141–0.629, p = 0.001) (Table 2).
| Adjusted for age, gender, marriage status, and employment status. | ||||
| Table 2. Logistic regression analysis of MNA-SF, SCREEN II, and GLIM for Depression Risk | ||||
|
|
|
|||
|
|
|
|
|
|
| MNA-SF |
|
|
|
|
| SCREEN II |
|
|
|
|
| GLIM |
|
|
|
|
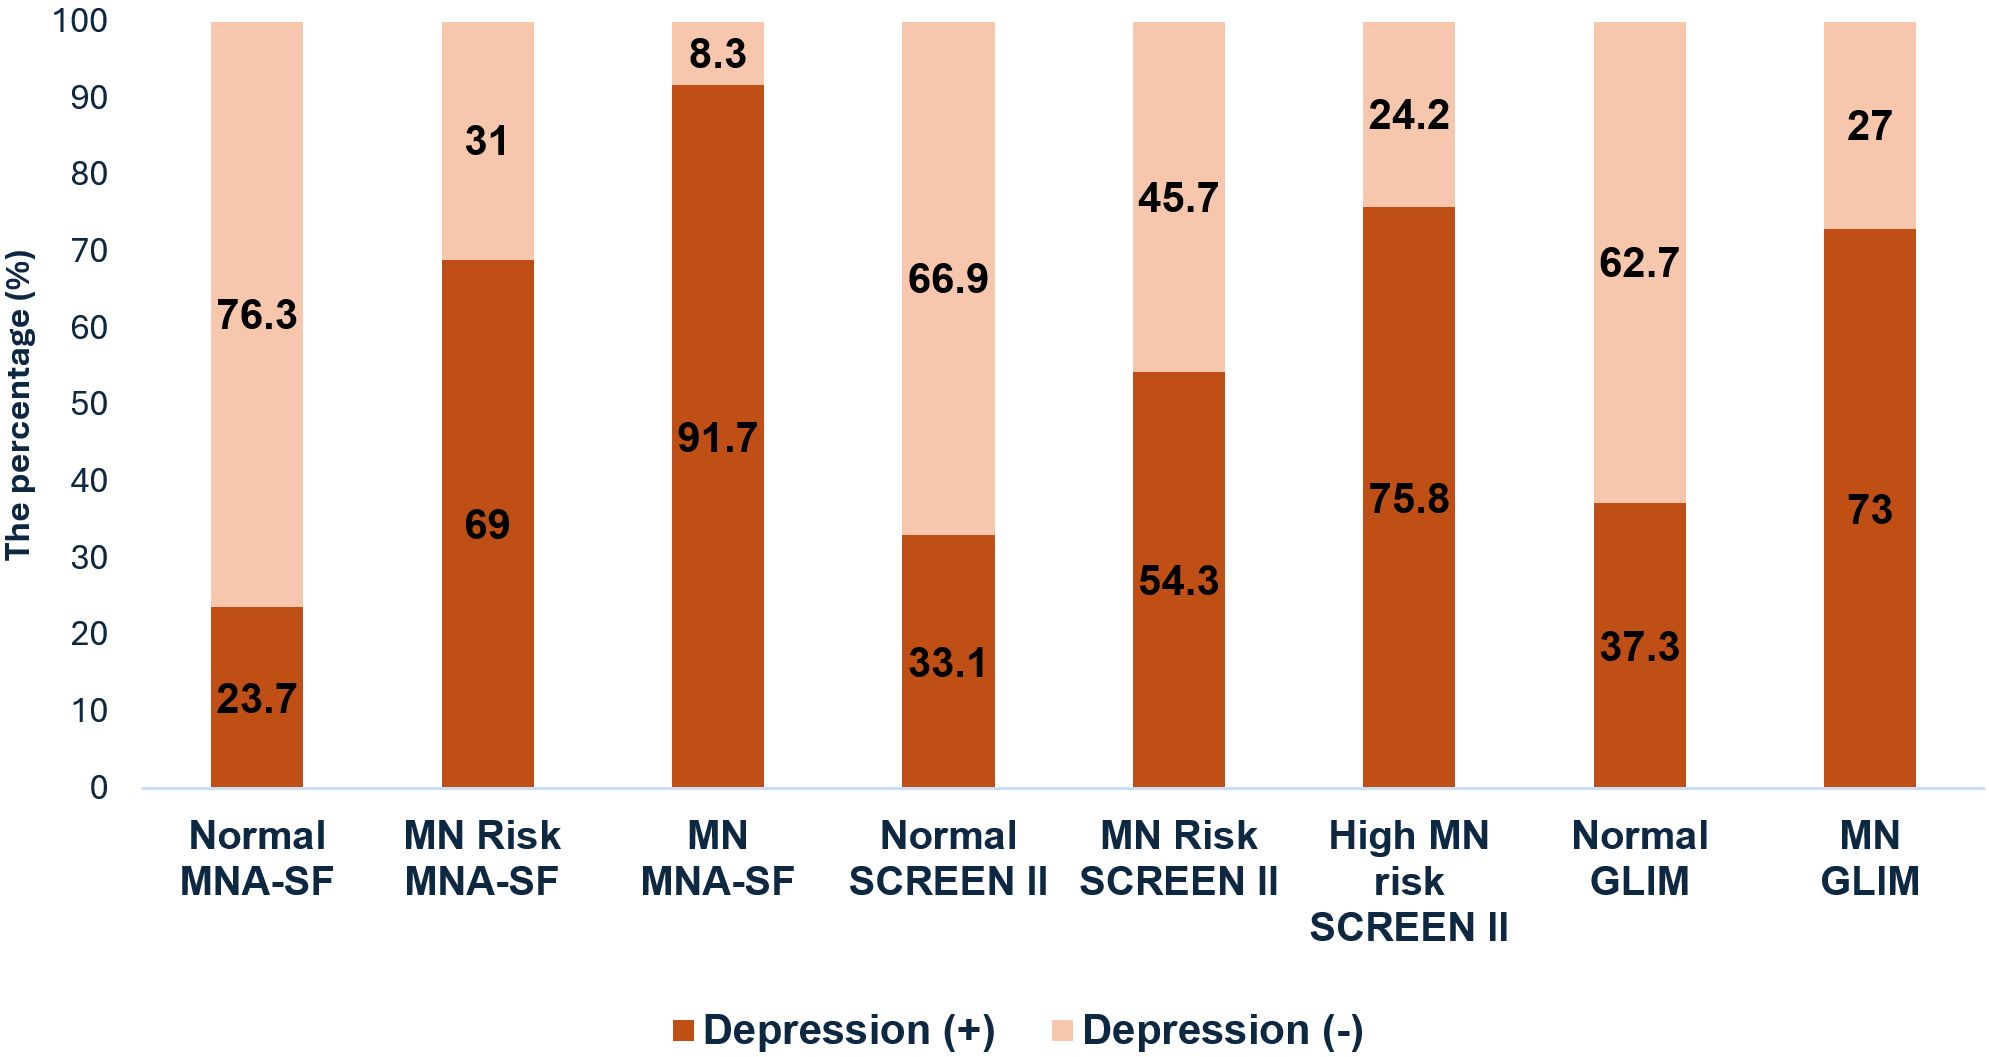
ROC analyses were performed to evaluate the predictive performance of the three tools. MNA-SF had the highest predictive accuracy (AUC = 0.765, 95% CI: 0.704–0.826, p < 0.001) at a cut-off point of 11.5, yielding a sensitivity of 80.6% and specificity of 66.4%. SCREEN II showed moderate predictive performance (AUC = 0.700, 95% CI: 0.635–0.766, p < 0.001) at a cut-off of 42.5, with sensitivity of 63.9% and specificity of 66.4%. GLIM had the lowest predictive ability (AUC = 0.590, 95% CI: 0.518–0.663, p = 0.014) (Figure 2).
Pairwise DeLong comparisons indicated that MNA-SF and SCREEN II had significantly higher AUCs than GLIM (MNA-SF vs. GLIM: p < 0.001; SCREEN II vs. GLIM: p = 0.013), whereas the difference between MNA-SF and SCREEN II was not statistically significant (p = 0.18), suggesting comparable predictive performance for these two screening tools.
Discussion
To our knowledge, this study is the first to compare the predictive value of MNA-SF, SCREEN II, and GLIM for depression risk among community-dwelling older adults. All three tools were significantly associated with poorer nutritional status and higher depression risk, even after adjusting for sociodemographic factors. Furthermore, MNA-SF and SCREEN II showed similar predictive performance, whereas GLIM demonstrated significantly lower discriminative ability.
Our findings are consistent with previous studies demonstrating a strong association between malnutrition and depression in older adults. A study of 262 older adults reported that individuals with depressive symptoms, as assessed by GDS, were approximately five times more likely to be at risk of malnutrition or malnourished according to MNA-SF (OR=5.82, 95%CI=2.27–14.89) than those without depression.14 Similarly, Pehlivan et al., in a study of 695 older adults, found that a 1-unit increase in MNA score was associated with a 1.201-unit decrease in GDS score.15 Another study also reported that the presence of malnutrition, as reflected by MNA, was linked to an increased risk of depression among older adults.16 In addition, research in 189 geriatric rehabilitation patients demonstrated that the severity of malnutrition assessed by GLIM criteria was associated with higher odds of depressive mood at discharge (moderate malnutrition: OR=3.84, p=0.005; severe malnutrition: OR=5.11, p=0.003).17 While prior studies have examined the association between MNA-SF or GLIM-defined malnutrition and depression, to our knowledge, no previous studies have specifically investigated the relationship between SCREEN II scores and depressive symptoms in older adults.
ROC analyses in our study revealed differences in the predictive performance of the three malnutrition assessment tools. MNA-SF demonstrated the highest accuracy (AUC = 0.765), with a cut-off of 11.5 yielding a sensitivity of 80.6% and specificity of 66.4%, indicating its strong ability to identify individuals at risk of depression. SCREEN II showed moderate predictive performance (AUC = 0.700) at a cut-off of 42.5, with balanced sensitivity and specificity (63.9% and 66.4%, respectively). The lower predictive ability of SCREEN II compared to MNA-SF may be explained by the fact that SCREEN II evaluates both unintentional weight loss and weight gain, whereas depression is more strongly associated with weight loss and appetite reduction. In contrast, GLIM displayed the lowest discriminative ability (AUC = 0.590), suggesting that while GLIM-defined malnutrition is associated with depression at the group level, it is less effective at predicting depression in individuals.
Although GLIM was strongly associated with depression in logistic regression, its ROC-based predictive performance was limited. This discrepancy may be attributed to the binary nature of GLIM classification, which captures only the presence or absence of malnutrition, whereas MNA-SF and SCREEN II provide continuous gradations of nutritional risk. The non-significant difference between MNA-SF and SCREEN II suggests that both tools perform comparably in predicting depression risk, although MNA-SF had a slightly higher AUC. These results emphasize the complementary value of combining screening and diagnostic nutritional assessments when evaluating the relationship between nutrition and mental health in older adults.
This study has several limitations that should be acknowledged. First, its cross-sectional design precludes any inference of causality between malnutrition and depression; the observed associations do not establish temporal relationships. Second, although the Geriatric Depression Scale (GDS) is a validated screening tool, it relies on self-report, which may be influenced by recall bias or social desirability. Thirdly, the study did not assess longitudinal changes in nutritional status or depressive symptoms, limiting the ability to evaluate the dynamic interplay between malnutrition and depression over time. Fourth, due to the convenience sampling method, findings cannot be generalized to all community-dwelling older adults.
In conclusion, MNA-SF, SCREEN II, and GLIM were all significantly associated with an increased risk of depression among community-dwelling older adults. MNA-SF demonstrated the highest predictive accuracy, supporting its utility for early identification of individuals at risk. Routine nutritional assessment may help facilitate timely and targeted interventions to mitigate depression risk in older populations.
Ethical approval
This study protocol was approved by Agrı Ibrahim Cecen University Ethics Committee (Number: 298, Date: 26.06.2025).
Source of funding
The author declare the study received no funding.
Conflict of interest
The author declare that there is no conflict of interest.
Data availability statement
The data that support the findings of this study are available from the corresponding author upon reasonable request.
References
- Dent E, Wright ORL, Woo J, Hoogendijk EO. Malnutrition in older adults. Lancet. 2023;401:951-966. https://doi.org/10.1016/S0140-6736(22)02612-5
- Micek A, Błaszczyk-Bębenek E, Cebula A, et al. The bidirectional association of malnutrition with depression and anxiety in patients with cancer: a systematic review and meta-analysis of evidence. Aging Clin Exp Res. 2025;37:162. https://doi.org/10.1007/s40520-025-03071-y
- Islam MZ, Disu TR, Farjana S, Rahman MM. Malnutrition and other risk factors of geriatric depression: a community-based comparative cross-sectional study in older adults in rural Bangladesh. BMC Geriatr. 2021;21:572. https://doi.org/10.1186/s12877-021-02535-w
- Ahmed H, Khaled H, Allam AA, et al. Depression in geriatrics: a systematic review and meta-analysis of prevalence and risk factors in Egypt. BMC Geriatr. 2024;24:930. https://doi.org/10.1186/s12877-024-05484-2
- Maier A, Riedel-Heller SG, Pabst A, Luppa M. Risk factors and protective factors of depression in older people 65+. A systematic review. PLoS One. 2021;16:e0251326. https://doi.org/10.1371/journal.pone.0251326
- Fitriana I, Setiati S, Rizal EW, et al. Malnutrition and depression as predictors for 30-day unplanned readmission in older patient: a prospective cohort study to develop 7-point scoring system. BMC Geriatr. 2021;21:256. https://doi.org/10.1186/s12877-021-02198-7
- Corish CA, Bardon LA. Malnutrition in older adults: screening and determinants. Proc Nutr Soc. 2019;78:372-379. https://doi.org/10.1017/S0029665118002628
- Kaiser MJ, Bauer JM, Ramsch C, et al. Validation of the mini nutritional assessment short-form (MNA-SF): a practical tool for identification of nutritional status. J Nutr Health Aging. 2009;13:782-788. https://doi.org/10.1007/s12603-009-0214-7
- Karam G, Abbas N, El Korh L, Abi Saad A, Nasreddine L, Ouaijan K. The association of cognitive ımpairment and depression with malnutrition among vulnerable, community-dwelling older adults: a large cross-sectional study. Geriatrics (Basel). 2024;9:122. https://doi.org/10.3390/geriatrics9050122
- Keller HH, Goy R, Kane SL. Validity and reliability of SCREEN II (Seniors in the community: risk evaluation for eating and nutrition, Version II). Eur J Clin Nutr. 2005;59:1149-1157. https://doi.org/10.1038/sj.ejcn.1602225
- Borkent JW, Keller H, Wham C, Wijers F, de van der Schueren MAE. Cross-country differences and similarities in undernutrition prevalence and risk as measured by screen ıı in community-dwelling older adults. Healthcare (Basel). 2020;8:151. https://doi.org/10.3390/healthcare8020151
- Cederholm T, Jensen GL, Correia MITD, et al. GLIM criteria for the diagnosis of malnutrition - A consensus report from the global clinical nutrition community. J Cachexia Sarcopenia Muscle. 2019;10:207-217. https://doi.org/10.1002/jcsm.12383
- Burke WJ, Houston MJ, Boust SJ, Roccaforte WH. Use of the geriatric depression scale in dementia of the alzheimer type. J Am Geriatr Soc. 1989;37:856-860. https://doi.org/10.1111/j.1532-5415.1989.tb02266.x
- Velázquez-Alva MC, Irigoyen-Camacho ME, Cabrer-Rosales MF, et al. Prevalence of malnutrition and depression in older adults living in nursing homes in Mexico City. Nutrients. 2020;12:2429. https://doi.org/10.3390/nu12082429
- Pehlivan M, Bakırhan H, Özyürek Arpa F, İncedal Irgat S. Can malnutrition, dietary habits, and diet quality be determinant factors in frailty, sarcopenia, low physical function, and depression in older adults? BMC Geriatr. 2025;25:785. https://doi.org/10.1186/s12877-025-06433-3
- Chrzastek Z, Guligowska A, Soltysik B, et al. Association of lower nutritional status and education level with the severity of depression symptoms in older adults-a cross sectional survey. Nutrients. 2021;13:515. https://doi.org/10.3390/nu13020515
- Shimizu A, Maeda K, Ueshima J, et al. Association of GLIM-defined malnutrition with depressive mood in older adults undergoing rehabilitation. Eur J Clin Nutr. 2025;79:597-603. https://doi.org/10.1038/s41430-025-01584-3
Copyright and license
Copyright © 2026 The author(s). This is an open-access article under the terms of the Creative Commons Attribution License (CC BY) which permits unrestricted use, distribution, and reproduction in any medium or format, provided the original work is properly cited.