
Abstract
Objective: Skeletal muscle loss is a common problem in patients admitted to the intensive care unit (ICU) following acute ischemic stroke and adversely affects prognosis. This study aimed to monitor the changes in rectus femoris muscle (RFM) thickness over time using ultrasound and to evaluate whether plasma C-terminal agrin fragment (CAF) levels reflect muscle loss.
Methods: A total of 44 patients (23 women, 21 men) diagnosed with acute ischemic stroke and requiring ICU care were included in the study. Demographic data and body mass index (BMI) were recorded. RFM thickness was measured on days 1, 7, and 21 using a 7.5 MHz ultrasound probe. Plasma CAF levels were measured from venous blood samples on days 7 and 21. RFM thickness and CAF levels were analyzed statistically.
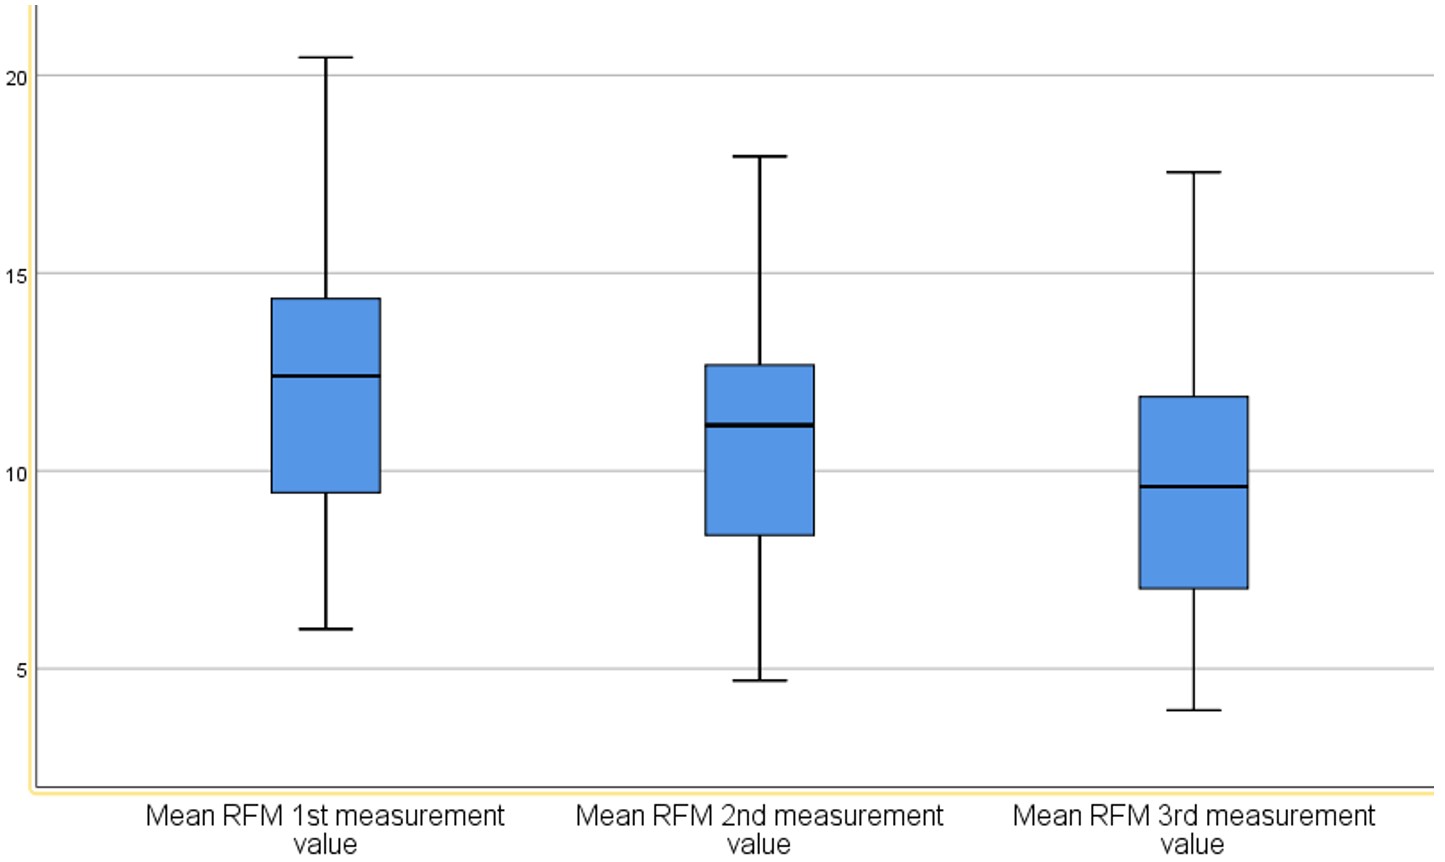
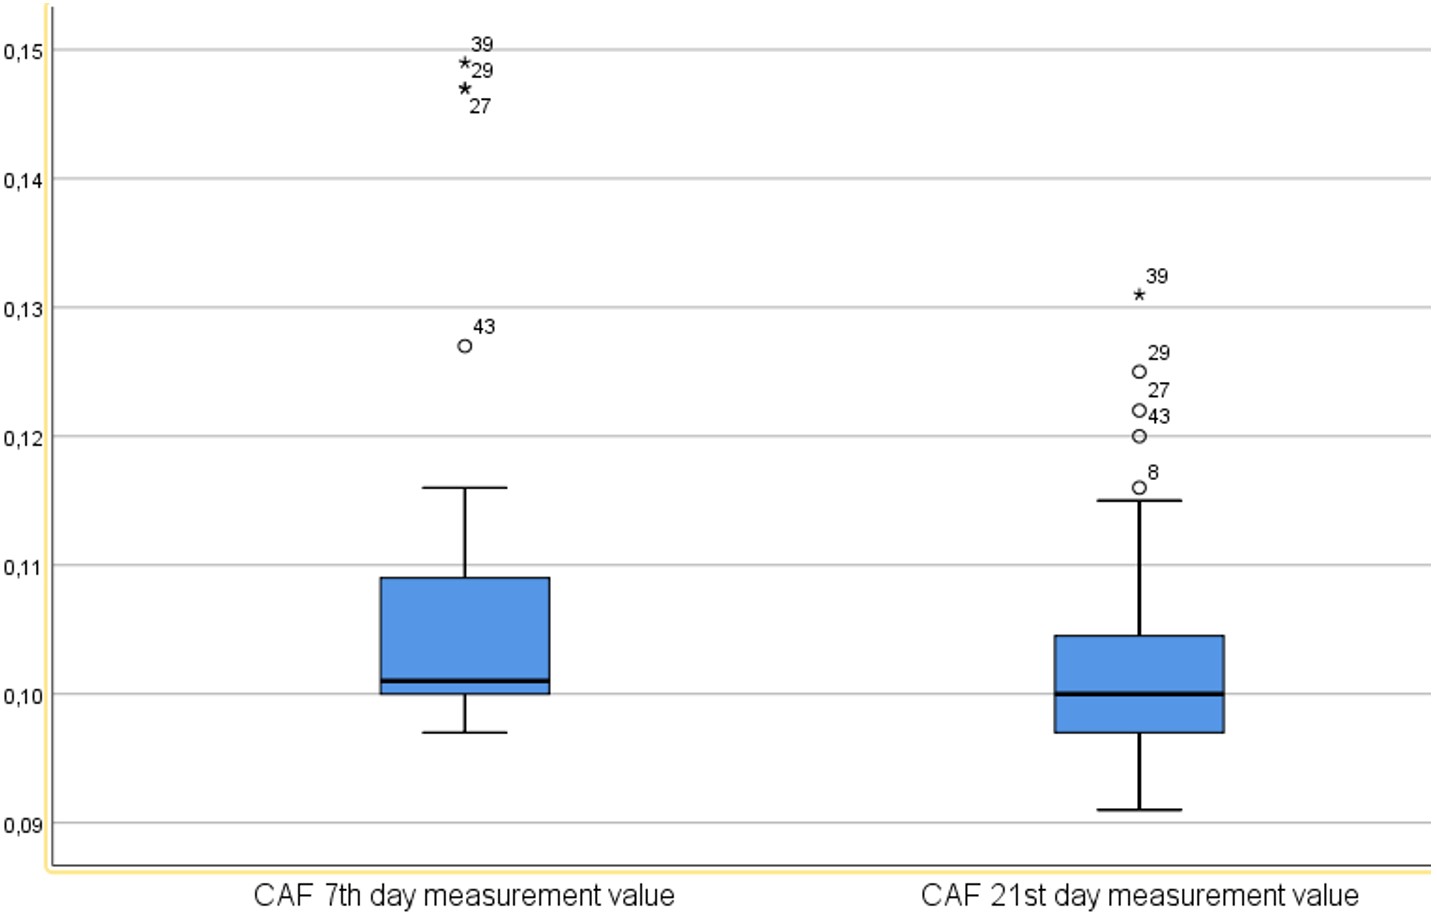
Results: Mean RFM thickness (right and left) (in mm) was 11.98 (range: 6.00 to 20.45) on day 1, 10.84 (range: 4.70 to 17.95) on day 7, and 9.74 (range: 3.95 to 17.55) on day 21 (p < 0.001). Plasma CAF levels also showed a significant change between day 7 and day 21 (p < 0.001). However, the difference in RFM thickness between days 7 and 21 showed a weak, non-significant negative correlation with the corresponding difference in CAF levels (r = –0.023, p > 0.05).
Conclusions: Patients with acute ischemic stroke in the ICU experience significant and progressive muscle loss. While plasma CAF has been proposed as a biomarker of muscle mass and function, its utility in tracking muscle loss remains uncertain.
Keywords: C-terminal agrin fragment, ischemic stroke, rectus femoris muscle thickness, ultrasound
Main Points
- Patients with acute ischemic stroke who are monitored in the intensive care unit experience significant muscle loss that worsens over time.
- Ultrasound remains a reliable, non-invasive method for the early detection and monitoring of muscle atrophy.
- While plasma CAF has been proposed as a biomarker of muscle mass and function, its utility in tracking muscle loss remains uncertain.
Introduction
Stroke, defined as neurological impairment resulting from vascular injury to the central nervous system,1 is a leading cause of death and long-term disability among adults worldwide.2 Acute ischemic stroke, in particular, is a critical condition that requires timely and appropriate intervention, as it significantly affects patients’ functional capacity.3
Prolonged immobilization following acute ischemic stroke leads to substantial skeletal muscle loss, hindering recovery.1 Muscle atrophy that occurs after stroke onset is referred to as ‘stroke-related sarcopenia’ and is associated with adverse clinical outcomes, including increased mortality and impaired physical function.4 This condition is more pronounced in intensive care patients and contributes to greater muscle weakness and higher mortality rates.5 Stroke-related sarcopenia is reported in up to 42% of stroke patients, affecting both the involved and uninvolved limbs.6,7
Monitoring muscle loss is essential for improving post-stroke outcomes.8 Several tools are used to assess skeletal muscle mass after stroke, including computed tomography (CT), ultrasound, bioelectrical impedance analysis (BIA), dual-energy X-ray absorptiometry (DEXA), biomarkers, and anthropometric measurements.9 Among these, ultrasound is particularly useful for patients with limited mobility or those without easy access to CT or MRI.10
Beyond physical measurements, muscle loss is also being investigated using biochemical markers for a more comprehensive assessment.11 In 2012, the European Working Group on Sarcopenia in Older People (EWGSOP) proposed the C-terminal agrin fragment (CAF), a biomarker of neuromuscular junction (NMJ) stability, as a potential tool for evaluating sarcopenia.12 Subsequent studies have confirmed that CAF can be detected in circulation and may reflect skeletal muscle degradation.13 Agrin is a protein critical to NMJ integrity, and its excessive cleavage by neurotrypsin produces CAF, which may contribute to NMJ dysfunction.13 Research has shown that NMJ breakdown and muscle denervation play a key role in the pathogenesis of sarcopenia.11,14-16
Accurately assessing skeletal muscle loss, both physically and biochemically, is crucial for developing effective rehabilitation strategies and incorporating early interventions into stroke care.17
The primary aim of this study was to evaluate time-dependent changes in rectus femoris muscle thickness using ultrasound in patients with acute ischemic stroke admitted to the intensive care unit, and to assess the extent to which these changes were associated with muscle loss. The secondary aim was to examine plasma CAF levels and assess their potential as a biomarker for tracking and evaluating skeletal muscle loss.
Material and Method
Study population and data collection
This observational prospective descriptive study was conducted between April 2023 and May 2024 on 44 patients diagnosed with acute ischemic stroke based on clinical and neuroimaging findings and monitored in the Neurology Intensive Care Unit of Dicle University Medical Faculty Hospital, Diyarbakır, Türkiye. Informed written consent was obtained from all participants or, in the case of patients with moderate to severe neurological deficits, from their first-degree relatives or legal representatives. All procedures were approved by the Dicle University Non-Invasive Clinical Research Ethics Committee (Approval No: 207, Date: June 09, 2022).
Inclusion criteria included: age ≥18 years, NIHSS (National Institutes of Health Stroke Scale) score ≥5, diagnosis of moderate or moderately severe acute ischemic stroke, and a modified Rankin Scale (mRS) score ≤2.
Exclusion criteria included: age <18 years; NIHSS <5; mRS ≥3; BMI ≥40 or ≤18; orthopedic, traumatic, or structural abnormalities and deformities of the lower extremities (e.g., fractures, dislocations, burn scars); oncologic diseases; severe renal or hepatic failure; advanced heart failure; severe dementia or cognitive impairment due to neurodegenerative diseases; severe psychiatric disorders; progressive chronic inflammatory or rheumatologic diseases; skeletal disorders preventing supine positioning (e.g., kyphoscoliosis); and ICU stays of less than 21 days due to death, early discharge, or rehabilitation.
All patients included in the study presented with moderate to moderately severe neurological deficits (NIHSS ≥5). The most common neurological findings were hemiparesis or hemiplegia, frequently accompanied by varying degrees of facial weakness and speech disturbance. Sensory deficits were present in approximately half of the patients, and the severity of motor impairment ranged from mild paresis to complete hemiplegia.
For all included patients, demographic characteristics (age, sex), BMI, APACHE II (Acute Physiology and Chronic Health Evaluation II) scores, and ICU length of stay were recorded. Height was measured on the first day of ICU admission in the supine position using a tape measure from the top of the head to the heel and recorded in centimeters. Body weight was measured in kilograms using a Rotkon scale integrated into a Dolsan hospital bed.
Approximately 75% of the patients (n = 32) required mechanical ventilation (median duration: 7 days, range: 3–14 days). The mean ICU length of stay was 21 days, and the mean total hospital stay was 28 days. During the ICU follow-up, routine physiotherapy interventions were implemented.
These interventions included early passive joint mobilization, proper positioning, and respiratory exercises, performed under the supervision of a physiotherapist or with nursing assistance at least twice daily. Active mobilization and neuromotor rehabilitation programs were initiated only in patients who were clinically stable, cooperative, and extubated.
Nutritional management
Patients with inadequate oral intake (n = 27) received enteral nutrition via a nasogastric tube, mainly during the first two weeks of their intensive care unit stay, due to the need for intubation or insufficient oral intake tolerance; patients with adequate intake (n = 17) continued oral feeding. Approximately two-thirds of the patients required mechanical ventilation, and some were able to tolerate oral intake after extubation. None of the patients required parenteral nutrition. Caloric and protein requirements were calculated according to intensive care nutrition guidelines, targeting approximately 25–30 kcal/kg/day and 1.2–1.5 g protein/kg/day.
During the ICU follow-up period, nutritional screening using the Nutrition Risk Screening-2002 (NRS-2002) scale identified mild-to-moderate malnutrition or malnutrition risk in approximately one-third of the patients (n = 13, 30%), whereas no severe malnutrition was observed.
Serum albumin, prealbumin, and C-reactive protein (CRP) levels were measured periodically during ICU follow-up.
Ultrasound assessment of stroke-related skeletal muscle loss
The rectus femoris muscle (RFM) is a standard site for assessing muscle mass via ultrasound. RFM thickness was measured on days 1, 7, and 21 of ICU admission using a Toshiba SSH-140A ultrasound device with a 7.5 MHz PLF-703NT transducer. Patients were positioned supine, with relaxed and extended knees, and toes pointing upward. The transducer was placed perpendicular to the long axis of the thigh with minimal pressure. Measurements were obtained bilaterally from both the paretic and non-paretic limbs at two-thirds of the distance between the anterior superior iliac spine and the proximal patella. Three consecutive measurements were obtained from each limb, and the mean RFM thickness was recorded in millimeters. All assessments were performed by the same intensive care and ultrasound specialist to minimize inter-operator variability. Results were reported as mean ± standard deviation.
Plasma CAF measurements
Plasma CAF levels were determined on days 7 and 21 using 5 mL blood samples drawn from the forearm vein. Samples were collected into EDTA-containing tubes, centrifuged at 4°C and 4000g for 10 minutes, and plasma was separated and stored in two Eppendorf tubes at −80°C. Analyses were performed using a BT Lab® ELISA kit according to the manufacturer’s instructions. Frozen samples were thawed at room temperature prior to analysis, and repeated freeze-thaw cycles were avoided. CAF concentrations were quantitatively measured by ELISA in the clinical biochemistry laboratory.
Plasma CAF measurements were initiated on day 7 to avoid the effects of transient metabolic or stress-related fluctuations during the hypercatabolic acute phase and to ensure that the results more accurately reflected neuromuscular junction (NMJ) degradation. It was also considered that measurable changes in CAF levels were more likely to emerge within the first week. This approach is also consistent with a study investigating CAF dynamics in critical illness.18
Statistical analysis
Data analysis was performed using SPSS (Statistical Package for the Social Sciences). Descriptive statistics were expressed as mean, standard deviation, frequency, and percentage. For non-normally distributed variables, median and interquartile range (IQR) were used. Normality was assessed through visual methods (histograms and probability plots) and statistical tests (Kolmogorov-Smirnov and Shapiro-Wilk). For non-normally distributed variables, the Wilcoxon signed-rank test was used for paired comparisons, and the Friedman test was used for comparing three or more related groups. Correlations between non-normally distributed variables were assessed using Spearman’s correlation coefficients. A Type I error threshold of 5% was used, and p-values <0.05 were considered statistically significant.
Results
Forty-four patients were included in the study, consisting of 23 women (52.27%) and 21 men (47.73%). The mean age was 69.52 years (range: 55 to 82 years). The average APACHE II score was 13.38, ranging from 8 to 22. The mean BMI was 27.20, with values between 21.28 and 37.46 (Table 1).
| Table 1. Patient demographics | |||||
| Variable |
|
|
|
|
|
| Age (years) |
|
|
|
|
|
| BMI (kg/m2) |
|
|
|
|
|
| APACHE II |
|
|
|
|
|
| Sex (n, %) |
Female |
|
|
||
| Male |
|
|
|||
During the ICU follow-up, serum albumin levels on days 1, 7, and 21 were 3.4 ± 0.5, 3.2 ± 0.4, and 3.1 ± 0.4 g/dL, respectively. Prealbumin levels were 22.6 ± 4.8 mg/dL, 20.8 ± 4.5 mg/dL, and 19.3 ± 4.1 mg/dL on the same days. CRP levels were initially elevated (11.8 ± 3.6 mg/dL) and gradually decreased over time, reaching 8.2 ± 3.0 mg/dL on day 7 and 5.4 ± 2.1 mg/dL on day 21.
Nutritional screening using the Nutrition Risk Screening-2002 (NRS-2002) scale identified mild-to-moderate malnutrition or malnutrition risk in approximately one-third of the patients (n = 13, 30%), whereas no severe malnutrition was observed.
The right RFM thickness was measured on days 1, 7and 21 as 11.98 mm (range: 4.00 to 20.30 mm), 10.85 mm (range: 4.90 to 18.00 mm), and 9.94 mm (range: 4.10 to 16.90 mm), respectively. A statistically significant difference was observed among the three measurements (p<0.001). Pairwise comparisons using Bonferroni correction also showed statistically significant differences between all three time points (p<0.001) (Table 2).
| *Friedman test. | ||||||||
| Table 2. Comparison of right rectus femoris muscle thickness by day | ||||||||
| Day |
|
|
|
|
|
|
|
|
| Day 1 |
|
|
|
|
|
|
|
|
| Day 7 |
|
|
|
|
|
|
|
|
| Day 21 |
|
|
|
|
|
|
|
|
Left RFM thickness on days 1, 7, and 21 was measured as 11.98 mm (range: 5.80 to 20.60 mm), 10.82 mm (range: 4.00 to 17.90 mm), and 9.55 mm (range: 2.90 to 18.20 mm), respectively. A significant difference was found across the three time points (p<0.001). Pairwise comparisons using Bonferroni correction also revealed statistically significant reductions at each time point (p<0.001) (Table 3).
| *Friedman test. | ||||||||
| Table 3. Comparison of left rectus femoris muscle thickness by day | ||||||||
| Day |
|
|
|
|
|
|
|
|
| Day 1 |
|
|
|
|
|
|
|
|
| Day 7 |
|
|
|
|
|
|
|
|
| Day 21 |
|
|
|
|
|
|
|
|
A comparison of the mean RFM (right and left) thickness measurements on days 1, 7, and 21 revealed a statistically significant difference across the three time points (p<0.001). Pairwise comparisons between the three measurements, adjusted using the Bonferroni correction, also showed statistically significant differences (p<0.001) (Table 4, Figure 1).
| *Friedman test. | ||||||||
| Table 4. Comparison of the mean RFM (right and left) thicknesses by day | ||||||||
| Day |
|
|
|
|
|
|
|
|
| Day 1 |
|
|
|
|
|
|
|
|
| Day 7 |
|
|
|
|
|
|
|
|
| Day 21 |
|
|
|
|
|
|
|
|
On the paretic side, the mean RFM thickness was 11.16 ± 3.48 mm on day 1, 10.13 ± 3.39 mm on day 7, and 8.96 ± 3.46 mm on day 21, whereas on the non-paretic side, the corresponding values were 12.74 ± 3.19 mm, 11.54 ± 3.22 mm, and 10.62 ± 3.24 mm, respectively. The differences between sides were statistically significant at all time points (p <0.001). Bilateral comparisons showed a progressive reduction in muscle thickness over time on both sides, with a more pronounced decline on the paretic side. These findings indicate a progressive and significant loss of muscle thickness, particularly on the affected side.
Plasma CAF levels were measured on days 7 and 21. A statistically significant reduction was found between the two time points (p<0.001) (Table 5, Figure 2).
| *Wilcoxon test. | ||||||||
| Table 5. Change in plasma C-terminal agrin fragment levels by day | ||||||||
| Time Point | Mean | SD | Min | Max | 25th Pctl | Median | 75th Pctl | p* |
| Day 7 | 0.10689 | 0.01268 | 0.09700 | 0.14900 | 0.10000 | 0.10100 | 0.11000 | <0.001 |
| Day 21 | 0.10295 | 0.00851 | 0.09100 | 0.13100 | 0.09700 | 0.10000 | 0.10525 | |
Association between RFM thickness and plasma CAF levels
When the difference in mean right and left RFM thickness between day 1 and day 7 measurements was compared with the change in CAF levels between day 7 and day 21 measurements, a moderate positive but statistically non-significant correlation was found (r = 0.294, p> 0.05).
When the difference in mean RFM thickness (right+left) between day 1 and day 21 measurements was compared with the difference in CAF levels between day 7 and day 21 measurements, a weak positive and statistically non-significant correlation was observed (r = 0.262, p> 0.05).
When the difference in mean RFM thickness (right+left) between day 7 and day 21 measurements was compared with the difference in CAF levels between the same time points, a weak negative and statistically non-significant correlation was observed (r=-0.023, p> 0.05) (Table 6).
| *Spearman test. | |||
| Table 6. Correlation between differences in mean RFM thickness (right and left) and plasma CAF levels. | |||
| Change in Mean RFM Thickness (Right and Left) | Change in CAF Levels | ||
| Day 1 to Day 7 | Day 7 to Day 21 |
|
|
|
|
|
||
| Day 1 to Day 21 | Day 7 to Day 21 |
|
|
|
|
|
||
| Day 7 to Day 21 | Day 7 to Day 21 |
|
|
|
|
|
||
Discussion
In this single-center study, we assessed rectus femoris muscle loss using ultrasound and measured plasma CAF levels in patients with acute ischemic stroke admitted to a neurology ICU. Our findings indicate a significant and progressive reduction in the thickness of both right and left rectus femoris muscles during the ICU stay. However, no clear correlation was observed between changes in average RFM thickness and plasma CAF levels across different measurement combinations. Consistent with the literature, our results align with previous findings on post-stroke muscle loss.
Muscle atrophy typically results from immobilization, neurological damage, and inflammatory processes. These effects are often accelerated in critically ill patients. Considering the limited mobility of stroke patients, ultrasound emerges as a reliable, bedside, and non-invasive tool for tracking muscle loss, especially in cases where access to CT or MRI is limited.10,19
Our findings demonstrated a progressive reduction in rectus femoris muscle (RFM) thickness on both sides during the ICU stay, with a more pronounced decline on the paretic side. This observation is consistent with previous ultrasound-based studies reporting greater muscle wasting in paretic limbs after stroke. In particular, Park et al. (2022) reported significantly reduced quadriceps muscle thickness on the paretic side in acute hemiplegic stroke patients.20
Pardo et al. investigated the reliability of ultrasound measurements of quadriceps muscle thickness and its progression over the first three weeks post ICU admission in 29 critically ill patients. They measured quadriceps muscle thickness on days 1, 3, 5, 7, and 21 using a 12 MHz linear probe, and found that quadriceps femoris muscle thickness decreased by more than 16% in the first week and by 24% by day 21.21
Parry et al.22 analyzed sequential ultrasound images of the quadriceps in 22 adult patients who were intubated for more than 48 hours. Measurements were taken during the first 10 days, upon awakening, and at discharge. The study reported a 30% reduction in vastus intermedius and rectus femoris thickness and cross-sectional area within the first 10 days of ICU admission.
Gruther et al.8 also measured quadriceps femoris thickness using ultrasound in ICU patients. They included 17 pilot patients with baseline and 28-day measurements and an additional 101 randomly selected ICU patients. The study showed that muscle thickness was significantly associated with length of stay, with greater muscle loss occurring in the first 2–3 weeks. The findings support ultrasound as a valid and practical tool for daily muscle assessment.
Tillquist et al. demonstrated that bedside ultrasound performed by various healthcare professionals without prior ultrasound experience was a practical and reliable method for assessing quadriceps muscle layer thickness (QMLT) in healthy volunteers.3
In a study by English et al., the test-retest reliability of ultrasound-based muscle thickness measurements was evaluated in patients with acute stroke. Measurements taken at four anatomical sites—anterior upper arm, posterior upper arm, abdomen, and anterior thigh—were found to be within acceptable reliability ranges, supporting the use of ultrasound in these regions.23
In our study, we observed a 9.73% decrease in RFM thickness within the first week of ICU admission, reaching 20.27% by day 21. A statistically significant association was found between length of ICU stay and muscle mass (p <0.01). These results support the notion that muscle loss accelerates during the early stages of ICU admission and highlight the importance of monitoring muscle thickness. Additionally, ultrasound proved to be a reliable tool for detecting and tracking muscle loss and offers valuable insights into its progression during critical illness.
Scherbakov et al. investigated the potential of CAF in assessing muscle mass and physical performance after acute stroke.24 They compared 123 patients with ischemic or hemorrhagic stroke undergoing rehabilitation with 26 age- and BMI-matched healthy controls. CAF levels were significantly higher in stroke patients and partially decreased during rehabilitation. CAF was associated with physical performance parameters, grip strength, and muscle cell integrity. Notably, improvement in grip strength of the paretic arm was independently associated with a reduction in CAF levels, but only in patients who showed an increase in muscle mass. These findings suggest that CAF may reflect dynamic changes in muscle condition during the subacute phase after stroke and highlight its potential role in guiding rehabilitation, warranting further investigation.
Monti et al. reviewed all published studies from 2013 (when CAF was first measured in human serum) to 2022 that included CAF measurements.25 Their comprehensive analysis examined CAF’s role in aging and muscle-wasting conditions. CAF levels were found to be elevated in older adults and patients with sarcopenia, as well as in non-sarcopenic conditions such as diabetes, COPD, chronic heart failure, cancer, and stroke. The review emphasized that renal function may affect CAF levels and should not be overlooked. Importantly, the authors noted that increased CAF levels due to immobilization could be mitigated through exercise. CAF may be a reliable biomarker for assessing muscle mass and function, though its clinical utility still requires validation through broader studies.
In our study, no inverse correlation was identified between plasma CAF levels and muscle thickness. While a moderate correlation was observed between changes in right RFM measurements and CAF levels, this relationship was not evident for the left side. Overall, no clear association was found between mean RFM thickness (right+left) measurements and plasma CAF levels.
Limitations
Several factors may have influenced our findings. These include the timing of CAF measurements, the single-center design, the characteristics of the patient population, the ELISA kit used, the sample size, and the exclusion of patients with advanced systemic diseases such as severe heart or renal failure. These variables may have affected the relationship between CAF levels and muscle loss.
In addition, the lack of serial NIHSS assessments prevented the evaluation of longitudinal correlations between changes in neurological status, RFM thickness, and CAF levels.
Conclusions
In ICU patients with acute ischemic stroke, significant changes in RFM thickness across all time points indicate that muscle loss is both progressive and continuous. These findings support the presence of substantial muscle wasting that worsens over time. Ultrasound remains a reliable, non-invasive method for the early detection and monitoring of muscle atrophy.
Although plasma CAF has been proposed as a potential biomarker for muscle mass and function, its utility in tracking muscle loss remains uncertain. Future multicenter studies with larger and more diverse patient populations, incorporating additional biochemical markers, are needed to clarify the relationship between CAF levels and muscle loss.
Ethical approval
This study has been approved by the Non-Interventional Clinical Research Ethics Committee of Dicle University (approval date 09.06.2022, number 207). Written informed consent was obtained from the participants.
Source of funding
The authors declare the study received no funding.
Conflict of interest
The authors declare that there is no conflict of interest.
References
- Bernhardt J, Hayward KS, Kwakkel G, et al. Agreed definitions and a shared vision for new standards in stroke recovery research: the stroke recovery and rehabilitation roundtable taskforce. Int J Stroke. 2017;12:444-450. https://doi.org/10.1177/1747493017711816
- Adams HP, Bendixen BH, Kappelle LJ, et al. Classification of subtype of acute ischemic stroke. Definitions for use in a multicenter clinical trial. TOAST. Trial of Org 10172 in Acute Stroke Treatment. Stroke. 1993;24:35-41. https://doi.org/10.1161/01.str.24.1.35
- Hacke W, Kaste M, Bluhmki E, et al. Thrombolysis with alteplase 3 to 4.5 hours after acute ischemic stroke. N Engl J Med. 2008;359:1317-1329. https://doi.org/10.1056/NEJMoa0804656
- Park JG, Lee KW, Kim SB, Lee JH, Kim YH. Effect of decreased skeletal muscle index and hand grip strength on functional recovery in subacute ambulatory stroke patients. Ann Rehabil Med. 2019;43:535-543. https://doi.org/10.5535/arm.2019.43.5.535
- Schefold JC, Wollersheim T, Grunow JJ, Luedi MM, Z’Graggen WJ, Weber-Carstens S. Muscular weakness and muscle wasting in the critically ill. J Cachexia Sarcopenia Muscle. 2020;11:1399-1412. https://doi.org/10.1002/jcsm.12620
- Su Y, Yuki M, Otsuki M. Prevalence of stroke-related sarcopenia: a systematic review and meta-analysis. J Stroke Cerebrovasc Dis. 2020;29:105092. https://doi.org/10.1016/j.jstrokecerebrovasdis.2020.105092
- English C, McLennan H, Thoirs K, Coates A, Bernhardt J. Loss of skeletal muscle mass after stroke: a systematic review. Int J Stroke. 2010;5:395-402. https://doi.org/10.1111/j.1747-4949.2010.00467.x
- Gruther W, Benesch T, Zorn C, et al. Muscle wasting in intensive care patients: ultrasound observation of the M. quadriceps femoris muscle layer. J Rehabil Med. 2008;40:185-189. https://doi.org/10.2340/16501977-0139
- Nakanishi N, Okura K, Okamura M, et al. Measuring and monitoring skeletal muscle mass after stroke: a review of current methods and clinical applications. J Stroke Cerebrovasc Dis. 2021;30:105736. https://doi.org/10.1016/j.jstrokecerebrovasdis.2021.105736
- Berenpas F, Martens AM, Weerdesteyn V, Geurts AC, van Alfen N. Bilateral changes in muscle architecture of physically active people with chronic stroke: a quantitative muscle ultrasound study. Clin Neurophysiol. 2017;128:115-122. https://doi.org/10.1016/j.clinph.2016.10.096
- Curcio F, Ferro G, Basile C, et al. Biomarkers in sarcopenia: a multifactorial approach. Exp Gerontol. 2016;85:1-8. https://doi.org/10.1016/j.exger.2016.09.007
- Cesari M, Fielding RA, Pahor M, et al. Biomarkers of sarcopenia in clinical trials-recommendations from the international working group on sarcopenia. J Cachexia Sarcopenia Muscle. 2012;3:181-190. https://doi.org/10.1007/s13539-012-0078-2
- Drey M, Sieber CC, Bauer JM, et al. C-terminal agrin fragment as a potential marker for sarcopenia caused by degeneration of the neuromuscular junction. Exp Gerontol. 2013;48:76-80. https://doi.org/10.1016/j.exger.2012.05.021
- Casati M, Costa AS, Capitanio D, et al. The biological foundations of sarcopenia: established and promising markers. Front Med (Lausanne). 2019;6:184. https://doi.org/10.3389/fmed.2019.00184
- Kwan P. Sarcopenia, a neurogenic syndrome? J Aging Res. 2013;2013:791679. https://doi.org/10.1155/2013/791679
- Gonzalez-Freire M, de Cabo R, Studenski SA, Ferrucci L. The neuromuscular junction: aging at the crossroad between nerves and muscle. Front Aging Neurosci. 2014;6:208. https://doi.org/10.3389/fnagi.2014.00208
- He N, Ye H. Exercise and muscle atrophy. Adv Exp Med Biol. 2020;1228:255-267. https://doi.org/10.1007/978-981-15-1792-1_17
- Klawitter F, Laukien F, Fischer DC, et al. Longitudinal assessment of blood-based inflammatory, neuromuscular, and neurovascular biomarker profiles in intensive care unit-acquired weakness: a prospective single-center cohort study. Neurocrit Care. 2025;42:118-130. https://doi.org/10.1007/s12028-024-02050-x
- Pratt J, De Vito G, Narici M, et al. Plasma C-terminal agrin fragment as an early biomarker for sarcopenia: results from the genofit study. J Gerontol A Biol Sci Med Sci. 2021;76:2090-2096. https://doi.org/10.1093/gerona/glab139
- Park S, Kim Y, Kim SA, Hwang I, Kim DE. Utility of ultrasound as a promising diagnostic tool for stroke-related sarcopenia: a retrospective pilot study. Medicine (Baltimore). 2022;101:e30245. https://doi.org/10.1097/MD.0000000000030244
- Pardo E, El Behi H, Boizeau P, Verdonk F, Alberti C, Lescot T. Reliability of ultrasound measurements of quadriceps muscle thickness in critically ill patients. BMC Anesthesiol. 2018;18:205. https://doi.org/10.1186/s12871-018-0647-9
- Parry SM, El-Ansary D, Cartwright MS, et al. Ultrasonography in the intensive care setting can be used to detect changes in the quality and quantity of muscle and is related to muscle strength and function. J Crit Care. 2015;30:1151.e9-1151.14. https://doi.org/10.1016/j.jcrc.2015.05.024
- English CK, Thoirs KA, Fisher L, McLennan H, Bernhardt J. Ultrasound is a reliable measure of muscle thickness in acute stroke patients, for some, but not all anatomical sites: a study of the intra-rater reliability of muscle thickness measures in acute stroke patients. Ultrasound Med Biol. 2012;38:368-376. https://doi.org/10.1016/j.ultrasmedbio.2011.12.012
- Scherbakov N, Knops M, Ebner N, et al. Evaluation of C-terminal agrin fragment as a marker of muscle wasting in patients after acute stroke during early rehabilitation. J Cachexia Sarcopenia Muscle. 2016;7:60-67. https://doi.org/10.1002/jcsm.12068
- Monti E, Sarto F, Sartori R, et al. C-terminal agrin fragment as a biomarker of muscle wasting and weakness: a narrative review. J Cachexia Sarcopenia Muscle. 2023;14:730-744. https://doi.org/10.1002/jcsm.13189
Copyright and license
Copyright © 2025 The author(s). This is an open-access article under the terms of the Creative Commons Attribution License (CC BY) which permits unrestricted use, distribution, and reproduction in any medium or format, provided the original work is properly cited.
