
Abstract
Background: CAR is a novel biomarker that predicts disease prognosis in inflammation-related diseases such as stroke.
Aim: We aimed to evaluate the relationship between CAR and disease severity and nutritional status in patients with acute ischemic stroke (AIS).
Method: This research is a cross-sectional, descriptive study. The sample consists of 99 AIS patients. A face-to-face interview questionnaire was used to determine the sociodemographic characteristics. The nutritional status was assessed by NRS-2002, SNAQ, MUST, and SGA, and disease status was determined by NIHSS and Modified Rankin Scale. Anthropometric measurements were taken. Biochemical parameters were obtained retrospectively from the patient records.
Results: 21.2% (n = 21) of the patients had an NRS-2002 score ≥ 3. When the combined effect of NIHSS and MUST on CAR was evaluated using Univariate ANOVA, the main effect of both MUST and NIHSS separately was significant. However, the combined effect of NIHSS and MUST was not found (p > 0.05). CAR of those at low risk of malnutrition (6.2±13.7) was significantly lower than that of those at moderate risk of malnutrition (13.7±17.2) according to MUST (p < 0.05). NRS-2002 significantly predicted a higher CAR (B = 10.89, p = 0.002). CAR significantly predicted higher NIHSS (B = 0.02, p = 0.003). The total effect analysis showed that malnutrition was positively associated with disease severity (B = 0.72, p = 0.002).
Discussion: This study revealed that nutritional risk (NRS-2002) was significantly associated with disease severity (NIHSS), both directly and indirectly. CAR mediated this relationship. Using CAR may facilitate the detection of nutritional risk.
Keywords: nutrition, NIHSS, MUST, NRS-2002, CAR
Main Points
- CAR is significantly associated with both malnutrition risk and disease severity in patients with acute ischemic stroke (AIS).
- CAR partially mediates the effect of malnutrition on disease severity.
- Use of CAR may facilitate early identification of malnutrition risk and disease prognosis in patients with AIS.
Introduction
Stroke is the second most common cause of death and the third leading cause of disability-adjusted life years worldwide. Approximately 12 million stroke cases and 6.5 million stroke-related deaths occur annually.1 Acute ischemic stroke (AIS) is more common than hemorrhagic stroke (AHS) and is also the primary cause of temporary or chronic disability. It has important social and economic consequences.2It is known that inflammation occurs in the pathophysiology of AIS.3 Necrotic cells formed in the brain as a result ofvascular occlusion trigger inflammation.4 New biomarkers that will predict the patient’s prognosis, better understand the pathophysiology, and offer new treatment options may be beneficial.3 In recent years, the C-reactive protein (CRP) to albumin (ALB) ratio (CAR) has begun to be defined as a new inflammatory indicator. C-reactive protein is an acute-phase reactant produced by the liver, and its levels increase in response to inflammation. It is widely used as a clinical indicator of inflammatory status. ALB, also produced by the liver, is a useful marker reflecting both inflammatory and nutritional states.5CAR has previously been shown to be associated with inflammatory conditions and poor prognosis, including in diabetic nephropathy, cancer, and cardiovascular disease.6,7,8According to data from the NHANES cohort, high CAR is associated with an increased risk of long-term mortality for individuals who have had a stroke.9 In studies conducted on elderly patients with AIS, higher CAR was also associated with in-hospital mortality, hemorrhagic transformation, and worsening functional outcomes.10,11 This suggests that CAR can be used as a poor prognosis predictor.
Malnutrition is common in stroke patients, who are mostly elderly individuals. Malnutrition in stroke patients is recognized to be negatively associated with a variety of clinical outcomes, particularly disability and death, in both the short and long term.2,12Despite its importance for prevention and treatment, assessment of nutritional status is not sufficiently considered in the multidisciplinary approach to diagnosing and treating patients affected by acute or chronic diseases.2 In a study of 325 hospitals in 25 European countries, it was reported that routine nutritional status screening was performed in only 52% of hospitals.13 Malnutrition is a disordered nutritional state caused by a combination of inflammation and negative nutrient balance, leading to alterations in body composition and function. The definitive diagnosis of malnutrition should be based on the assessment of these factors.14 It is essential to identify a rapid, simple, cost-effective, and reliable approach for nutritional assessment that is validated in the clinical setting. Many tools/procedures are used for nutritional screening worldwide. Basic laboratory tests, such as albumin and CRP levels, have been incorporated into other tools as they are associated with inflammatory status and clinical outcomes.2Subjective assessment of malnutrition is challenging due to limitations inherent in screening and assessment tools, such as inter-observer variability, difficult reproducibility, requiring expert experience, and some tools being time-consuming and expensive.15Therefore, there is no gold standard for nutrition screening or a complete nutrition assessment.16
The fact that high CAR scores predict worsening prognosis in many inflammatory conditions and the association of both CRP and ALB with malnutrition suggest that they can be used as indicators of malnutrition in patients with AIS.
Albumin and CRP values are routinely evaluated, inexpensive, and easily accessible, which may provide convenience for clinicians. This study aimed to evaluate the association between CAR, nutritional risk (NRS-2002), and stroke severity (NIHSS) in patients with acute ischemic stroke.
Methods
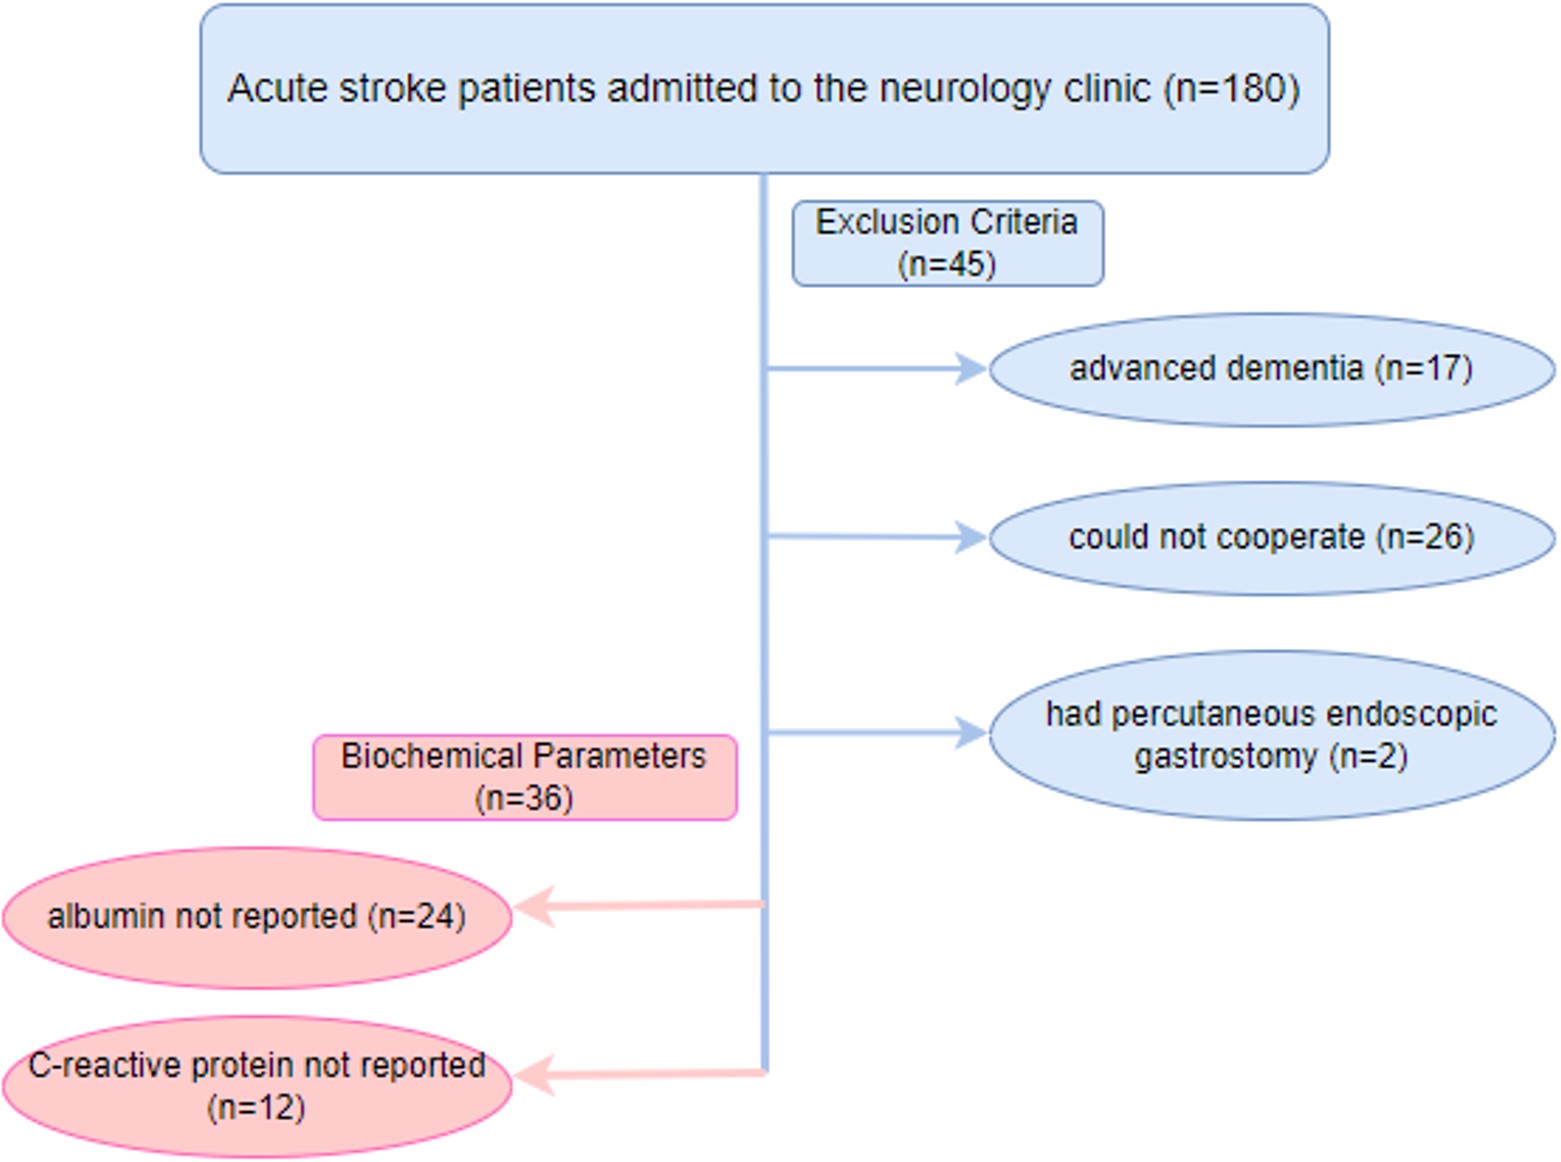
This research is a cross-sectional, descriptive study. The research sample consisted of 99 AIS patients hospitalized in the Neurology clinic of Kastamonu Training and Research Hospital between January and February 2024. Kastamonu University Clinical Research Ethics Committee approval was obtained for the study. The sample size in the study was calculated using G*Power 3.1 software. The analysis was performed using the “R² increase” option in the linear multiple regression model. Statistical significance was set at α = 0.05, test power was 80% (1–β = 0.80), and the effect size was accepted as moderate (f²=0.10), considering the findings on the relationship between CAR and stroke in the literature.17,18 According to these parameters, the minimum sample size was calculated as 81. Considering the probability of missing and incomplete data (15%), the target sample size was determined to be at least 93. Patients who were confused had advanced dementia, could not cooperate, were aphasic after stroke, had hemorrhagic stroke, or had PEG were excluded. The sample was selected using purposive and convenience sampling. Anthropometric measurements and biochemical data were obtained, and scales were applied within the first 3 days after hospitalization. A face-to-face interview questionnaire was used to determine the sociodemographic characteristics of the patients, such as age, occupation, marital status, and cohabitation status. The nutritional status of the patients was assessed by Nutritional Risk Screening-2002 (NRS-2002), Simplified Nutritional Assessment Questionnaire (SNAQ), Malnutrition Universal Screening Tool (MUST), Subjective Global Assessment (SGA), and disease status was determined by National Institutes of Health Stroke Scale (NIHSS), Modified Rankin Scale. The researchers took anthropometric measurements (height, weight, and mid-upper arm circumference ). Biochemical parameters were obtained retrospectively from the patient records. A flowchart of the study is given in Figure 1.
Anthropometric measurements
Height: When the individual is in the standard anatomical position, height is the measurement of the vertical distance from the ground to the vertex, the highest head point.19
Body weight: Weighing was preferably done in thin clothes and on an empty stomach.19
Body mass index (BMI): Body mass index values were calculated by dividing body weight by the square of height (Body weight (kg) / Height (m2)), and the results obtained were evaluated according to the World Health Organization (WHO) classification.20
Mid-upper arm circumference (MUAC): The left arm of the patient was bent 90 degrees, and the midpoint between the acromial process at the shoulder and the olecranon process at the elbow was marked. The arm was released, and the arm circumference was measured with a tape measure.19
Nutrition status
We included four different nutritional screening tools (SNAQ, NRS-2002, SGA, and MUST) in our study to provide a comprehensive framework and allow for comparison of other approaches. However, we focused our analyses primarily on the NRS-2002 and MUST because these two methods are the most widely used tools in clinical practice and provided the most appropriate results for our study sample.
Nutritional risk screening test-2002 (NRS-2002)
The nutritional risk screening test-2002 was developed by Kondrup et al. in 2002 to screen the risk of malnutrition in patients admitted to the hospital. The scoring system consists of two parameters: “nutritional status” and “disease severity”. A total NRS-2002 score ≥3 points is considered at high nutritional risk, while those with a score below 3 points are considered at low nutritional risk.21
Malnutrition universal screening tool (MUST)
It is a five-step screening tool recommended by the European Society for Clinical Nutrition and Metabolism (ESPEN) and the British Association for Parenteral and Enteral Nutrition (BAPEN). The total MUST score is interpreted as follows: a score of 0 indicates low risk of malnutrition; a score of 1 indicates medium risk; and a score of 2 or more indicates high risk.22
Simplified nutritional assessment questionnaire (SNAQ)
This screening method, developed by Kruizenga et al. (2005), includes parameters questioning the presence of recent weight loss, lack of appetite, and the status of receiving nutritional support. The total SNAQ score ranges from 4 to 20 points, with scores of 14 or below indicating a malnourished, while scores above 14 indicate a well-nourished23
Subjective global assessment (SGA)
Subjective global assessment is a screening tool described by Detsky et al. (1984). Patients are evaluated subjectively based on data obtained from clinical assessment and physical examination. Gastrointestinal symptoms are considered only if they have been present for ≥ 2 weeks. According to the Subjective Global Assessment (SGA), patients are classified as nourished (A), mild to moderately malnourished (B), or severely malnourished (C) 24
Disease Severity
National institutes of health stroke scale (NIHSS):
The NIHSS is a scale for determining stroke severity. It has 11 categories and a score ranging from 0 to 42. The NIHSS Stroke Scale measures various aspects of brain function, including consciousness, vision, sensation, movement, speech, and language. A certain number of points is given for each of these physical and cognitive functions during a focused neurological examination.25
Modified rankin scale
It is used to measure the degree of disability and dependency in patients due to stroke or another neurological problem. It is a scale that evaluates between 0 and 6 points.26
Biochemical Parameters
Biochemical parameters (Creatinine, ALB, CRP, Cholesterol, Triglycerides, Low Density Lipoprotein [LDL], High Density Lipoprotein [HDL]) were obtained retrospectively from the patient records.
CRP albumin ratio (CAR) was calculated by dividing CRP by ALB.
Statistical analysis
IBM SPSS 25 program was used to analyze the data. The values of descriptive variables were expressed as number (n), percentage (%), mean, standard deviation (SD), median, and minimum and maximum values. The normality of data was tested using the Kolmogorov-Smirnov test. The chi-square test was used to compare categorical variables. Mann-Whitney U test was used for non-normally distributed data. A Univariate ANOVA test was used to evaluate the effect of disease severity and nutritional risk on CAR. The significance level was set at p < 0.05. The mediating role of CAR in the relationship between disease severity (NIHSS) and nutritional risk (NRS-2002) was analyzed using Hayes’ PROCESS macro (version 4.2).
Results
General and clinical characteristics of the patients are given in Table 1. The number of patients included in the study was 99, and the mean age was 72.0±14.2 years. 21.2% (n = 21) of the patients had NRS-2002 score ≥3 and there was no difference between genders (p > 0.05). According to the SGA nutritional assessment tool, 94.9% of the patients had no malnutrition, whereas 3% had severe malnutrition. Nutritional screening results indicated that 33.3% were malnourished based on SNAQ (≥5% weight loss), 20.2% were at medium risk according to MUST, and no patient was categorized as high risk (p > 0.05). When the NIHSS scores of the patients were evaluated, 30.32% had no stroke symptoms, 28.3% had minor stroke, 33.3% had moderate stroke and 8.1% had severe stroke and there was no difference between genders (p > 0.05). Functional status evaluated by the modified Rankin Scale indicated that most patients had slight (25.3%) or moderate (17.2%) disability, while 22.2% had moderately severe disability and 15.2% had severe disability (p > 0.005). Anthropometric measurements showed a mean BMI of 28.5±5.6 kg/m² and MUAC of 28.8±3.6 cm, with no significant difference between genders. When the BMI of the patients was classified, 20.2% were underweight, 37.4% were normal weight and 42.4% were overweight.
| Chi-Square test # Mann Whitney U test BMI: Body Mass Index* While categorizing BMI, the World Health Organization BMI classification according to age was used. MUAC: Mid-upper arm circumference NRS 2002: Nutritional Risk Screening-2002 SNAQ: Simplified Nutritional Assessment Questionnaire MUST: Malnutrition Universal Screening Tool SGA: Subjective Global Assessment NIHSS: National Institutes of Health Stroke Scale. | ||||
| Table 1. General and clinical characteristics of the patients | ||||
|
|
|
|
|
|
| Age (Mean±SD) |
|
|
|
|
| Education |
|
|
|
|
| Illiterate |
|
|
|
|
| Literate |
|
|
|
|
| Primary school |
|
|
|
|
| Secondary school |
|
|
|
|
| High school |
|
|
|
|
| Undergraduate/graduate |
|
|
|
|
| Marital status | ||||
| Married |
|
|
|
|
| Single |
|
|
|
|
| Divorced |
|
|
|
|
| Lost spouse |
|
|
|
|
| Cohabitation status | ||||
| Alone at home |
|
|
|
|
| At home with spouse |
|
|
|
|
| With spouse and children |
|
|
|
|
| With children/relatives |
|
|
|
|
| Income | ||||
| Below minimum wage |
|
|
|
|
| Above minimum wage |
|
|
|
|
| Presence of other diseases | ||||
| No |
|
|
|
|
| Yes |
|
|
|
|
| Cardiovascular disease |
|
|
|
|
| Diabetes |
|
|
|
|
| Thyroid diseases |
|
|
|
|
| Respiratory diseases |
|
|
|
|
| Neurological diseases |
|
|
|
|
| Autoimmune diseases |
|
|
|
|
| Sensory loss |
|
|
|
|
| Nutritional screening tests | ||||
| NRS 2002 | ||||
| NRS-2002 score < 3 |
|
|
|
|
| NRS-2002 score ≥ 3 |
|
|
|
|
| SNAQ | ||||
| Well nourished (<5% weight loss) |
|
|
|
|
| Malnourished (≥5% weight loss) |
|
|
|
|
| MUST | ||||
| Low risk |
|
|
|
|
| Medium risk |
|
|
|
|
| High risk |
|
|
|
|
| SGA | ||||
| Nourished (A) |
|
|
|
|
| Mild to moderately malnourished (B) |
|
|
|
|
| Severely malnourished (C) |
|
|
|
|
| NIHSS | ||||
| No stroke symptoms |
|
|
|
|
| Minor stroke |
|
|
|
|
| Moderate stroke |
|
|
|
|
| Severe stroke |
|
|
|
|
| Modified Rankin Scale | ||||
| No symptoms |
|
|
|
|
| No significant disability |
|
|
|
|
| Slight disability |
|
|
|
|
| Moderate disability |
|
|
|
|
| Moderately severe disability |
|
|
|
|
| Severe disability |
|
|
|
|
| Anthropometric measurements |
|
|
|
|
| BMI |
|
|
|
|
| MUAC |
|
|
|
|
| BMI Classification* |
|
|
|
|
| Underweight |
|
|
|
|
| Normal |
|
|
|
|
| Overweight |
|
|
|
|
The evaluation of biochemical parameters of the patients according to nutritional risk status (NRS 2002 ) is given in Table 2. Serum albumin median values of patients with an NRS-2002 score ≥ 3 (3.5 [1.8 - 4.0]) were significantly lower than those of patients with NRS-2002 scores <3 (3.7 [2.8 - 4.7]) (p < 0.05). Median CRP levels were 22.0 mg/L (range: 0.8–307.2) in patients with NRS-2002 scores ≥ 3, compared with 5.8 mg/L (0.2–189.5) in those with scores < 3 (p = 0.008). Similarly, the median CRP/albumin ratio (CAR) was 7.1 (0.2–83.0) in an NRS-2002 scores ≥ 3, 1.6 (0.0–67.7) in scores < 3 (p = 0.004).Total cholesterol, triglyceride, and HDL values of those with NRS-2002 scores ≥ 3 were lower than those with NRS-2002 scores < 3 (p = 0.049, p = 0.045, p = 0.016, respectively).
| *Mann Whitney U test, CRP: C- reaktive protein ALB: Albumin CAR: CRP/ALB ratio LDL: Low-density lipoprotein, HDL: High-density lipoprotein, NRS 2002: Nutritional Risk Screening-2002 | ||||
| Table 2. Evaluation of biochemical parameters of patients according to nutritional risk status (NRS-2002) | ||||
| Biochemical parameters |
|
|
|
|
|
|
|
|
||
| Creatinine mg/dL |
|
|
|
|
| ALB g/dL |
|
|
|
|
| CRP mg/dL |
|
|
|
|
| CAR |
|
|
|
|
| Total Cholesterol mg/dL |
|
|
|
|
| Triglycerides mg/dL |
|
|
|
|
| LDL mg/dL |
|
|
|
|
| HDL mg/dL |
|
|
|
|
The evaluation of CAR according to NIHSS and NRS-2002 score is given in Table 3. Descriptive statistics of Tables 3 and 4 are given in Table 5. The main effect of NRS-2002 score was not significant on CAR (p > 0.005). The main effect of NIHSS was significant on CAR (p < 0.05). Patients with no stroke symptoms, minor stroke, and moderate stroke had significantly lower CAR (2.9±4.3, 6.3±11.5, 8.0±15.0, respectively) than patients with severe stroke (29.2±27.6, p < 0.001). The combined effect of NIHSS and NRS-2002 scores on CAR was not significant (p > 0.05).
| R2= 0.225, Univariate ANOVA test. NIHSS: National Institutes of Health Stroke Scale, NRS: Nutritional Risk Screening-2002 | ||||||
| Table 3. Evaluation of CAR according to NIHSS and NRS-2002 score | ||||||
|
|
||||||
|
|
|
|
|
|
|
|
| NRS-2002 |
|
|
|
|
|
|
| NIHSS |
|
|
|
|
|
|
| NIHSS*NRS-2002 |
|
|
|
|
|
|
| R2= 0.301, Univariate ANOVA test. NIHSS: National Institutes of Health Stroke Scale, MUST: Malnutrition Universal Screening Tool. | ||||||
| Table 4. Evaluation of CAR according to NIHSS and MUST score | ||||||
|
|
||||||
|
|
|
|
|
|
|
|
| MUST |
|
|
|
|
|
|
| NIHSS |
|
|
|
|
|
|
| NIHSS*NRS-2002 |
|
|
|
|
|
|
| Univariate ANOVA test, Bonferroni test, a-b: No difference exists between scores with the same letter, CAR: C- reactive protein/Albumin ratio, NIHSS: National Institutes of Health Stroke Scale, NRS: Nutritional Risk Screening-2002, MUST: Malnutrition Universal Screening Tool. | |||||||
| Table 5. Descriptive statistics of Tables 3 and 4 | |||||||
| NIHSS |
|
|
|
|
|||
|
|
|
||||||
|
|
|
|
|
|
|||
| No stroke symptoms (n=30) |
|
|
|
|
|
|
|
| Minor stroke (n=28) |
|
|
|
|
|
|
|
| Moderate stroke (n=33) |
|
|
|
|
|
|
|
| Severe stroke (n=8) |
|
|
|
|
|
|
|
| Total (n=99) |
|
|
|
|
|
|
|
The evaluation of CAR according to NIHSS and MUST score is given in Table 4. The main effect of MUST score is significant on CAR (p < 0.001). The CAR of patients at low risk of malnutrition (6.2±13.7) was significantly lower than that of those at moderate risk of malnutrition (13.7±17.2) (p < 0.05). The main effect of NIHSS was significant on CAR (p < 0.05). The CAR of those with no stroke symptoms (2.6±2.8) was the lowest, while that of severe strokes (30.3±4.7) was significantly the highest. The combined effect of NIHSS and MUST scores on CAR was not significant (p > 0.05).
Mediation of the association between nutritional risk (NRS-2002) and disease severity (NIHSS) by the CAR is presented in Table 6. NRS-2002 significantly predicted a higher CAR (B = 10.89, p = 0.002). CAR significantly predicted higher NIHSS (B = 0.02, p = 0.003). The total effect analysis showed that nutritional risk was positively associated with disease severity (B = 0.72, p = 0.002). The direct effect indicated that even after controlling for CAR, nutritional risk remained a significant predictor of NIHSS (B = 0.51, p = 0.027). The indirect effect analysis demonstrated that the bootstrap 95% confidence interval [0.03, 0.45] did not include zero, thus confirming a significant partial mediation effect of CAR.
| Hayes’ PROCESS macro (version 4.2), B = unstandardized coefficient; SE = standard error; LLCI/ULCI = 95% bootstrap confidence interval lower/upper limits (5,000 samples). CAR: C- reactive protein/Albumin ratio, NIHSS: National Institutes of Health Stroke Scale, NRS: Nutritional Risk Screening-2002 | |||||||
| Table 6. Mediation of the association between nutritional risk (NRS-2002) and disease severity (NIHSS) by the CAR | |||||||
| Path |
|
|
|
|
|
|
|
| Path a NRS-2002 → CAR |
|
|
|
|
|
|
|
| Path b NRS-2002 → NIHSS |
|
|
|
|
|
|
|
| CAR → NIHSS |
|
|
|
|
|
|
|
| Total Effect (c path) |
|
|
|
|
|
|
|
| Direct Effect (c’ path) |
|
|
|
|
|
|
|
| Indirect Effect (a×b) |
|
|
|
|
|
|
|
Discussion
Malnutrition before and after AIS is responsible for longer hospital stays, worse functional outcomes, and increased mortality rates after stroke. Early detection of malnutrition using anthropometric measurements or laboratory parameters after AIS is important to prevent a poor prognosis. In the literature, malnutrition has been shown to increase as disease severity increases in patients with AISand that markers such as CRP and albumin are associated with disease severity.27,28 In recent years, CAR, a new biomarker used alongside CRP and albumin—indicators of systemic inflammation and nutritional status—is an independent prognostic marker in many diseases. In a study conducted in 2024 employing a method similar to ours, it was suggested that the CAR could be used as an indicator for assessing nutritional status in hemodialysis patients.29 This study aimed to evaluate the relationship of CAR with disease severity and malnutrition.
In the present study, 21.2% of patients were identified as being at nutritional risk according to NRS-2002. SNAQ identified 33.3% of patients as malnourished, while MUST indicated that 20.2% of patients were at medium risk, with no patients classified as high risk. There was no significant difference between genders. This prevalence is partially consistent with previous studies in stroke populations, which have reported varying rates of nutritional risk: 35–50% according to NRS-2002, 22–37% according to MUST, and 18.4% of patients classified as malnourished according to SNAQ.2,30 These findings indicate that a significant proportion of stroke patients are at risk of malnutrition, highlighting the critical importance of routine nutritional screening for early identification of at-risk individuals and timely implementation of interventions that can improve clinical outcomes.
In this study, patients at risk for malnutrition had lower median serum albumin levels (3.5 vs. 3.7 g/dL), indicating impaired protein status, consistent with previous reports linking hypoalbuminemia to malnutrition in stroke populations.31,32 Additionally, inflammatory markers were significantly higher in the high malnutrition risk group, with median CRP levels of 22.0 mg/L (0.8-307.2) compared with 5.8 mg/L (0.2-189.5) in the low malnutrition risk group (p = 0.008). This finding aligns with literature suggesting that malnourished patients frequently exhibit systemic inflammation, which may exacerbate nutritional deficiencies and worsen clinical outcomes.33 The observed differences in albumin and CRP highlight the utility of combining nutritional screening tools with biochemical markers for a more comprehensive assessment of nutritional status. Early identification of patients with laboratory findings of malnutrition and elevated inflammatory markers may allow for targeted nutritional interventions, improving recovery and reducing post-stroke complications.
In this study, based on NRS-2002, the CAR of patients with nutritional risk is higher than that of those without nutritional risk. When NRS-2002 and NIHSS were evaluated separately with the Univariate ANOVA test, it was found that NIHSS had a significant effect on CAR (p < 0.05), while NRS-2002 had no effect. NIHSS and NRS-2002 scores together do not have a significant impact on CAR. When MUST and NIHSS were evaluated separately, it was determined that both had a significant effect on CAR (p < 0.05). However, when NIHSS and MUST scores are evaluated together, there is no significant effect on CAR. CRP and albumin are acute phase proteins. As an acute phase reactant, CRP increases and albumin decreases in inflammation. Many studies have investigated the relationship between CRP and disease severity, functional outcome, in-hospital mortality, long-term mortality, and infarct volume in ischemic stroke patients.4,17 In a study where disease severity was measured using the Modified Rankin Score, it was found that disease severity increased with increased CAR values in young stroke patients.34 In a 116-month follow-up study examining the relationship between CAR values and disease prognosis, it was shown that there was a positive correlation between high CAR values and the risk of death from all causes in stroke patients.9 In a 6-year follow-up study conducted by Li et al., it was stated that CAR could be a proper measurement when predicting in-hospital mortality in elderly patients with ischemic stroke.10 In another study, high CAR was found to be associated with increased risk of hemorrhagic transformation and poor functional outcomes in individuals with ischemic stroke.11These data support that disease severity and prognosis are associated with increased CAR values, as we found in our study.
In Univariate ANOVA analysis, CAR values were more strongly correlated with disease severity (NIHSS), while no significant direct difference was observed with nutritional risk (NRS-2002). However, Hayes’ mediator analysis revealed an unseen indirect effect of this relationship. Nutritional risk (NRS-2002) increased CAR, while CAR increased disease severity (NIHSS). Furthermore, nutritional risk increased disease severity, and this effect was mediated through CAR. Previous studies have shown that nutritional risk is associated with the risk of stroke complications and that CAR is significantly associated with both functional outcomes and mortality.17,35 While these studies have investigated the relationships between disease severity, nutritional risk, and CAR separately, their interaction was not evaluated. In our study, we revealed the interaction of these variables and the mediating role of CAR. Inflammation is known to play a central role in the pathophysiology of stroke. Especially in the acute phase, systemic inflammation can accelerate both tissue damage and clinical deterioration; Parameters such as CAR emerge as sensitive indicators of this process. Therefore, the mediator role of CAR is consistent with the literature and is a unique aspect of our study. These data reveal a mechanism by which malnutrition not only directly increases stroke severity but also partially mediates this effect by interacting with inflammation. This highlights the importance of CAR in clinical practice for both early assessment of nutritional status and monitoring inflammation for stroke prognosis.
This study has several strengths. To our knowledge, it is the first to evaluate the combined effect of CAR on both malnutrition and disease severity in patients with AIS. The mediation analysis in this study explains the biological mechanism underlying this relationship in more detail. This study also has some limitations. Due to its cross-sectional design, causal relationships cannot be firmly established. The absence of a control group and the lack of assessment of prognostic parameters such as length of hospital stay, functional outcomes, or mortality constitute additional limitations of the study.
Conclusion
CRP and albumin are biomarkers routinely used in the clinic to assess malnutrition and inflammation. They are practical, economical, and frequently evaluated, especially in diseases such as AIS, which has inflammation in its pathophysiology and is often associated with malnutrition. According to the results of this study, CAR was found to be closely related to both disease severity and malnutrition. It was determined that CAR increases in malnutrition. Therefore, CAR may facilitate the detection of malnutrition, a condition that is challenging to diagnose and requires expertise. However, more comprehensive studies are needed to expand its routine use.
Ethical approval
This study has been approved by the Kastamonu University Clinical Research Ethics Committee (approval date 20.12.2023, number 2023-KAEK-178). Verbal informed consent was obtained from each patient who volunteered to participate in the study.
Source of funding
The authors declare the study received no funding.
Conflict of interest
The authors declare that there is no conflict of interest.
References
- Feigin VL, Stark BA, Johnson CO, et al. Global, regional, and national burden of stroke and its risk factors, 1990-2019: a systematic analysis for the Global Burden of Disease Study 2019. Lancet Neurol. 2021;20:795-820. https://doi.org/10.1016/S1474-4422(21)00252-0
- Di Vincenzo O, Luisi MLE, Alicante P, et al. The assessment of the risk of malnutrition (undernutrition) in stroke patients. Nutrients. 2023;15:683. https://doi.org/10.3390/nu15030683
- Tirandi A, Sgura C, Carbone F, Montecucco F, Liberale L. Inflammatory biomarkers of ischemic stroke. Intern Emerg Med. 2023;18:723-732. https://doi.org/10.1007/s11739-023-03201-2
- Ye Z, Zhang Z, Zhang H, et al. Prognostic value of C-reactive Protein and homocysteine in Large-Artery atherosclerotic stroke: a prospective observational study. J Stroke Cerebrovasc Dis. 2017;26:618-626. https://doi.org/10.1016/j.jstrokecerebrovasdis.2016.11.016
- Kocatürk M, Kocatürk Ö. Assessment of relationship between C-reactive protein to albumin ratio and 90-day mortality in patients with acute ischaemic stroke. Neurol Neurochir Pol. 2019;53:205-211. https://doi.org/10.5603/PJNNS.a2019.0020
- Hajibandeh S, Hajibandeh S, Romman S, et al. Preoperative C-reactive Protein-to-Albumin Ratio and its ability to predict outcomes of pancreatic cancer resection: a systematic review. Biomedicines. 2023;11:1983. https://doi.org/10.3390/biomedicines11071983
- Aktas G. Serum C-reactive protein to albumin ratio as a reliable marker of diabetic neuropathy in type 2 diabetes mellitus. Biomol Biomed. 2024;24:1380-1386. https://doi.org/10.17305/bb.2024.10426
- Yang X, Yang X, Yang J, Wen X, Wu S, Cui L. High levels of high-sensitivity C-reactive protein to albumin ratio can increase the risk of cardiovascular disease. J Epidemiol Community Health. 2023;77:721-727. https://doi.org/10.1136/jech-2023-220760
- Yuan J, Cheng Y, Han X, et al. Association between C-reactive protein/albumin ratio and all-cause mortality in patients with stroke: evidence from NHANES cohort study. Nutr Metab Cardiovasc Dis. 2024;34:2305-2314. https://doi.org/10.1016/j.numecd.2024.05.024
- Li M, Chen Y, Chen Z, et al. Dose-response relationship between C-reactive Protein/Albumin ratio and in-hospital mortality in elderly patients with acute ischemic stroke. Gerontology. 2024;70:125-133. https://doi.org/10.1159/000535074
- Xu T, Xia L, Wu Y, et al. High ratio of C-reactive protein to albumin is associated with hemorrhagic transformation and poor functional outcomes in acute ischemic stroke patients after thrombolysis. Front Aging Neurosci. 2023;15:1109144. https://doi.org/10.3389/fnagi.2023.1109144
- Huppertz V, Guida S, Holdoway A, et al. Impaired nutritional condition after stroke from the hyperacute to the chronic phase: a systematic review and meta-analysis. Front Neurol. 2022;12:780080. https://doi.org/10.3389/fneur.2021.780080
- Schindler K, Pernicka E, Laviano A, et al. How nutritional risk is assessed and managed in European hospitals: a survey of 21,007 patients findings from the 2007-2008 cross-sectional nutritionDay survey. Clin Nutr. 2010;29:552-559. https://doi.org/10.1016/j.clnu.2010.04.001
- Soeters P, Bozzetti F, Cynober L, Forbes A, Shenkin A, Sobotka L. Defining malnutrition: a plea to rethink. Clin Nutr. 2017;36:896-901. https://doi.org/10.1016/j.clnu.2016.09.032
- Serón-Arbeloa C, Labarta-Monzón L, Puzo-Foncillas J, et al. Malnutrition screening and assessment. Nutrients. 2022;14:2392. https://doi.org/10.3390/nu14122392
- Skipper A, Coltman A, Tomesko J, et al. Adult malnutrition (undernutrition) screening: an evidence analysis center systematic review. J Acad Nutr Diet. 2020;120:669-708. https://doi.org/10.1016/j.jand.2019.09.010
- Yang J, Chen Y, Wan J, et al. Prognostic value of the C-reactive protein to albumin ratio in patients with stroke: a meta-analysis. Sci Rep. 2025;15:21150. https://doi.org/10.1038/s41598-025-07327-5
- Gemalmaz H, Kaya İC, Kocaoglu AS, et al. The role of CRP/albumin ratio in predicting the risk of postoperative acute renal failure in patients undergoing coronary bypass surgery. Heart Surg Forum. 2025;28:E527-E537. https://doi.org/10.59958/hsf.8437
- Pekcan G. Beslenme durumunun saptanması: diyet el kitabı. 10th ed. Ankara: Hatiboğlu Yayınevi; 2018.
- World Health Organization (WHO). Obesity: preventing and managing the global epidemic. WHO Technical Report Series, No: 894. 2000. Available at: https://www.who.int/nutrition/publications/obesity/WHO_TRS_894/en/
- Kondrup J, Rasmussen HH, Hamberg O, Stanga Z, Ad Hoc ESPEN Working Group. Nutritional risk screening (NRS 2002): a new method based on an analysis of controlled clinical trials. Clin Nutr. 2003;22:321-336. https://doi.org/10.1016/s0261-5614(02)00214-5
- Elia M, ed. Screening for malnutrition: a multidisciplinary responsibility. Development and use of the ‘Malnutrition Universal Screening Tool’ (‘MUST’) for adults. Malnutrition Advisory Group (MAG) a Standing Committee of BAPEN; 2003. Available at: https://www.bapen.org.uk/pdfs/must/must-report.pdf
- Kruizenga HM, Seidell JC, de Vet HC, Wierdsma NJ, van Bokhorst-de van der Schueren MAE. Development and validation of a hospital screening tool for malnutrition: the Short Nutritional Assessment Questionnaire (SNAQ). Clin Nutr. 2005;24:75-82. https://doi.org/10.1016/j.clnu.2004.07.015
- Detsky AS, McLaughlin JR, Baker JP, et al. What is subjective global assessment of nutritional status? JPEN J Parenter Enteral Nutr. 1987;11:8-13. https://doi.org/10.1177/014860718701100108
- Williams LS, Yilmaz EY, Lopez-Yunez AM. Retrospective assessment of initial stroke severity with the NIH Stroke Scale. Stroke. 2000;31:858-862. https://doi.org/10.1161/01.str.31.4.858
- Rankin J. Cerebral vascular accidents in patients over the age of 60. II. Prognosis. Scott Med J. 1957;2:200-215. https://doi.org/10.1177/003693305700200504
- Sabbouh T, Torbey MT. Malnutrition in stroke patients: risk factors, assessment, and management. Neurocrit Care. 2018;29:374-384. https://doi.org/10.1007/s12028-017-0436-1
- Gomes F, Emery PW, Weekes CE. Risk of malnutrition is an independent predictor of mortality, length of hospital stay, and hospitalization costs in stroke patients. J Stroke Cerebrovasc Dis. 2016;25:799-806. https://doi.org/10.1016/j.jstrokecerebrovasdis.2015.12.017
- Tur K, Güçlü A. Independent association between malnutrition inflammation score and C-reactive Protein/Albumin ratio in hemodialysis patients. J Inflamm Res. 2024;17:9325-9333. https://doi.org/10.2147/JIR.S477307
- Cin A, Boyraz S, Ozturk V, Yaka E. Malnutrition in old patients with stroke. Turkish Journal of Cerebrovascular Diseases. 2019;25,155-163. https://doi.org/10.5505/tbdhd.2019.12599
- Gong L, Wang Y, Shi J. Enteral nutrition management in stroke patients: a narrative review. Ann Palliat Med. 2021;10:11191-11202. https://doi.org/10.21037/apm-21-2922
- Thuemmler RJ, Pana TA, Carter B, et al. Serum albumin and post-stroke outcomes: analysis of UK regional registry data, systematic review, and meta-analysis. Nutrients. 2024;16:1486. https://doi.org/10.3390/nu16101486
- Hao R, Qi X, Xia X, Wang L, Li X. Malnutrition on admission increases the in-hospital mortality and length of stay in elder adults with acute ischemic stroke. J Clin Lab Anal. 2022;36:e24132. https://doi.org/10.1002/jcla.24132
- Du Y, Zhang J, Li N, et al. Association between the C-reactive protein to albumin ratio and adverse clinical prognosis in patients with young stroke. Front Neurol. 2022;13:989769. https://doi.org/10.3389/fneur.2022.989769
- Chen X, Li D, Liu Y, Zhu L, Jia Y, Gao Y. Nutritional risk screening 2002 scale and subsequent risk of stroke-associated infection in ischemic stroke: the REMISE study. Front Nutr. 2022;9:895803. https://doi.org/10.3389/fnut.2022.895803
Copyright and license
Copyright © 2025 The author(s). This is an open-access article under the terms of the Creative Commons Attribution License (CC BY) which permits unrestricted use, distribution, and reproduction in any medium or format, provided the original work is properly cited.
